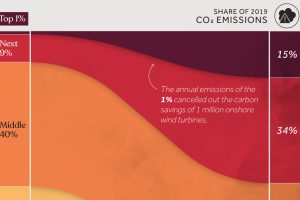
We visualize global CO2 emissions by income group, showing the impact of different wealth brackets on carbon generation. Read more

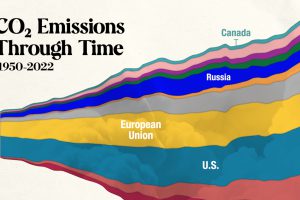
In this streamgraph, we break down global CO2 emissions between 1950 and 2022 using data from Berkeley Earth and Global Carbon Project. Read more

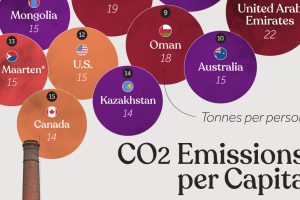
Which countries rank the highest in per capita carbon emissions, and how do they impact the world’s total carbon emissions? Read more

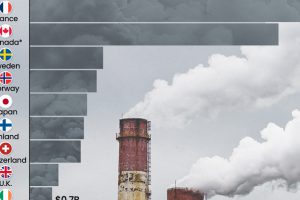
This graphic highlights France and Canada as the global leaders when it comes to generating carbon tax revenue. Read more

