Going on a cruise ship and flying domestically are the most carbon-intensive travel methods. Read more
World emissions have reached almost 50 billion tonnes of greenhouse gases (GHGs) and counting. Which major sectors do they originate from? Read more
The world’s growing focus on sustainability is a clear sign of the times. This map ranks the 40 greenest countries in the world. Read more
Watch how the energy mix of G20 countries has evolved over the last 50+ years. Read more
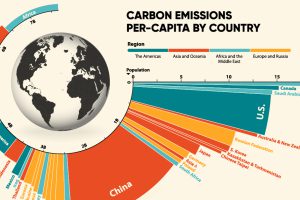
33.6 Gt of CO2 was emitted across the world in 2019. Here we visualize the global per capita CO2 emissions by country and region. Read more
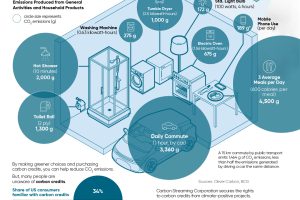
Discover how the average person’s carbon footprint impacts the environment and learn how carbon credits can offset your carbon footprint. Read more
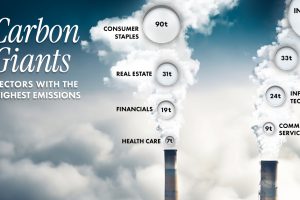
Comparing average Scope 1 emission intensities by sector according to an analysis done by S&P Global Inc. Read more

Which foods are linked with high CO2 emissions and high water use? We look at the environmental impacts of food production in this chart. Read more
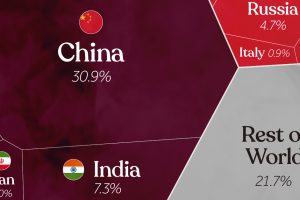
China, India, and the U.S. together account for roughly half of the world’s CO₂. This visual breaks down all carbon emissions by country. Read more


