
According to the EPA, the U.S. produced 292 million tons of solid waste in 2018, of which 150 million headed to some of the largest landfills in the country. Read more

While the number of U.S. wildfires has fallen in recent years, the total land burned has increased, pointing to the growing intensity and severity of these fires. Read more
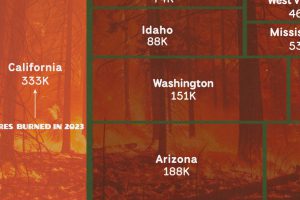
Just five states account for nearly half of all wildfire area burned in 2023. Read more
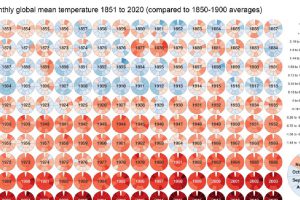
Global Temperature Graph (1851-2020) View the high-resolution of the infographic by clicking here. Since 1880, the Earth’s average surface temperature has risen by 0.07°C (0.13°F) every decade. That number alone… Read more
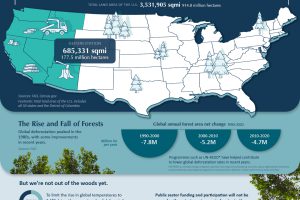
Deforestation over the last 30 years has led to a 177.5 million hectare reduction in world’s forests. See why these trends need to reverse swiftly in order to effectively manage… Read more
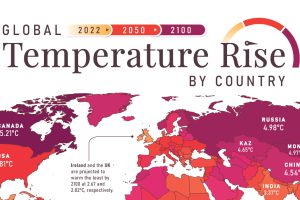
In this set of three maps, we show the global temperature rise on a national level for 2022, 2050, and 2100 based on an analysis by Berkeley Earth. Read more
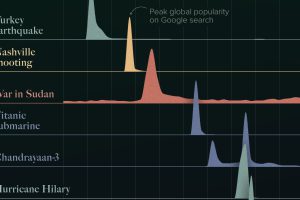
The top 10 news stories of 2023 according to Google Search trends, including two wars, three hurricanes, and a new moon landing. Read more

A survey looked at U.S. industry favorability across political lines, showing where Democrats and Republicans are divided over the economy. Read more

