

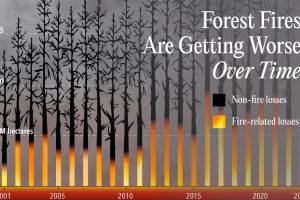
See how total forest cover lost has changed over the last 22 years, along with what portion comes from wildfire impact. Read more
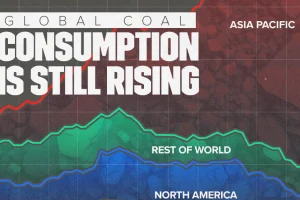
China remains the largest coal consumer, making up 56% of the global total. Read more
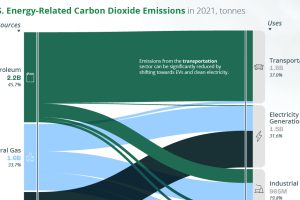
A look at the flow of energy-related CO2 emissions from the sources that generate energy to the sectors that use it. Read more
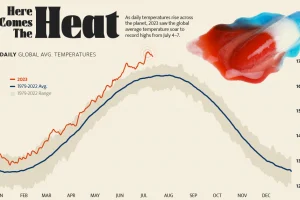
Four days straight in July 2023 set or equaled global temperature records on average. Read more
Antarctica’s ice extent has reached record lows. This visual details and maps Antarctica sea ice loss over the last two years. Read more

Which foods are linked with high CO2 emissions and high water use? We look at the environmental impacts of food production in this chart. Read more
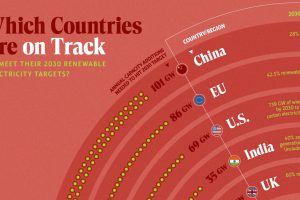
In this graphic, we visualize whether major electricity-consuming countries are on track to meet their 2030 renewable energy targets. Read more
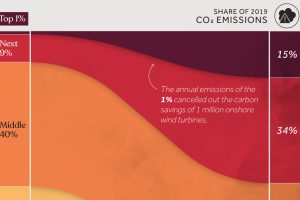
We visualize global CO2 emissions by income group, showing the impact of different wealth brackets on carbon generation. Read more
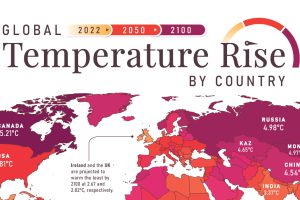
In this set of three maps, we show the global temperature rise on a national level for 2022, 2050, and 2100 based on an analysis by Berkeley Earth. Read more
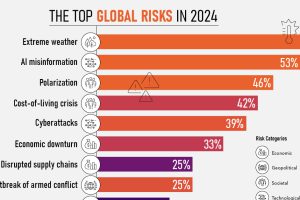
Here are global risk projections for 2024 as tensions in the Middle East escalate and major economies face elections this year. Read more