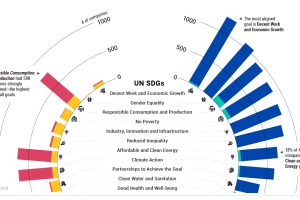
Are companies making progress in meeting the UN Sustainable Development Goals? This tracker shows how companies are measuring up. Read more
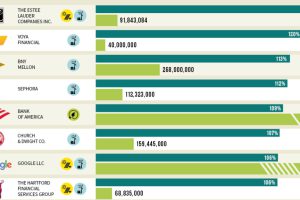
Which U.S. companies use the most green energy as a percentage of total energy used? Here are the 50 highest ranked companies according to the EPA. Read more

Here’s a look at the number of wildfires in America that have occurred each year since 1990, and the acres of forest land scorched during that period. Read more
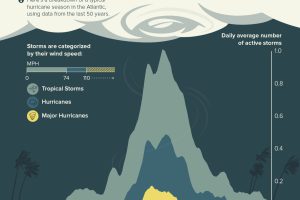
While the Atlantic hurricane season runs from June to late November, about 85% of activity happens between August, September, and October. Read more
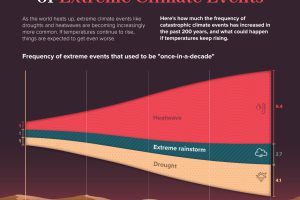
Extreme weather events, like droughts and heatwaves, have become more common over the years. But things are expected to get worse. Read more
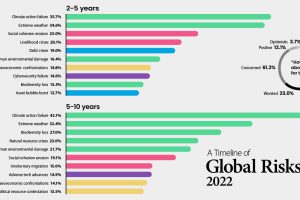
Which risks are top of mind in 2022? We visualize the World Economic Forum’s global risk assessment for top risks by impact and livelihood. Read more
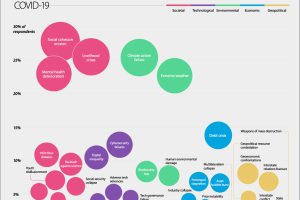
According to the World Economic Forum, the erosion of social cohesion is one of the risks that has worsened the most since COVID-19. Read more
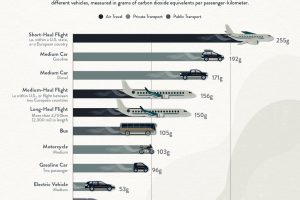
What’s the lowest-carbon way to travel? Here’s how much CO2 different types of vehicles emit per passenger-kilometer. Read more
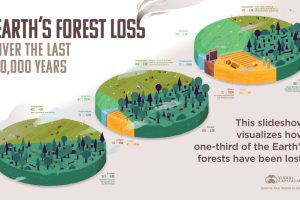
How much has the world’s land use changed over the last 10,000 years, and how have forests been impacted? Read more


