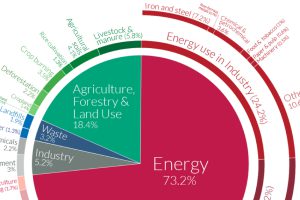
World emissions have reached almost 50 billion tonnes of greenhouse gases (GHGs) and counting. Which major sectors do they originate from? Read more
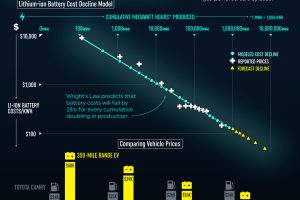
Declining battery costs are making electric vehicle prices more competitve. By 2023, EV prices could be on par with similar gas-powered vehicles. Read more
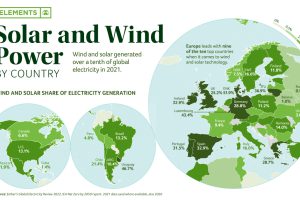
Wind and solar make up 10% of the world’s electricity. Combined, they are the fourth-largest source of electricity after coal, gas, and hydro. Read more
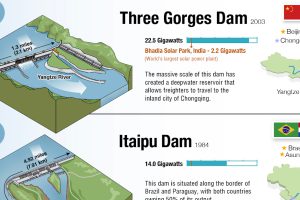
Hydroelectric dams generate 40% of the world’s renewable energy, the largest of any type. View this infographic to learn more. Read more
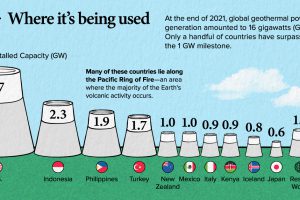
This infographic teaches you everything you need to know about geothermal energy in less than 5 minutes. Read more
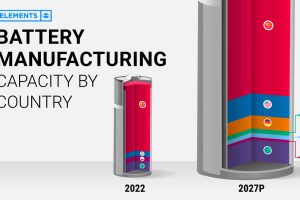
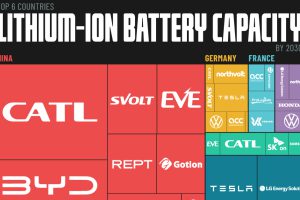
This infographic breaks down battery manufacturing capacity by country in 2022 and 2027. Read more

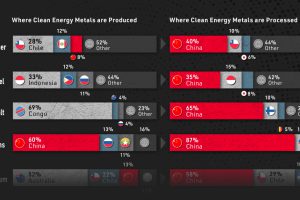
As the market for low-emission solutions expands, China dominates the production of clean energy technologies and their components. Read more
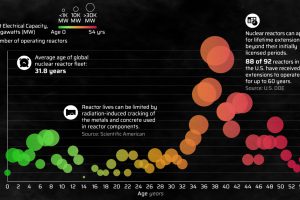
Explore the age distribution of the 422 nuclear reactors operating globally in this infographic. Read more


