

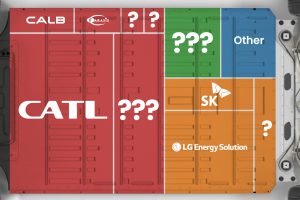
Asia dominates this ranking of the world’s largest EV battery manufacturers in 2023. Read more
Going on a cruise ship and flying domestically are the most carbon-intensive travel methods. Read more
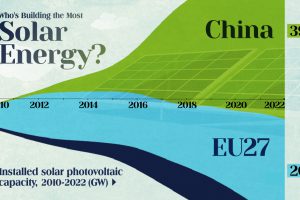
China’s solar capacity triples USA, nearly doubles EU. Read more

The commodity sector has struggled, but there is one area bucking the trend: energy metals. See the momentum in clean energy and the lithium revolution. Read more
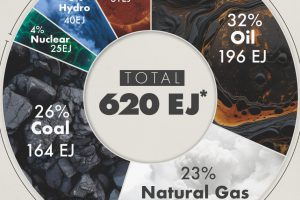
This graphic shows the sources of energy used globally in 2023, measured in exajoules, with fossil fuels making up 81% of the energy mix. Read more
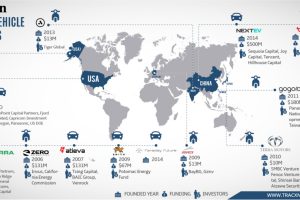
Imitation is the sincerest form of flattery. This infographic shows Tesla’s rivals that are vying to unseat the current titan of electric vehicles. Read more
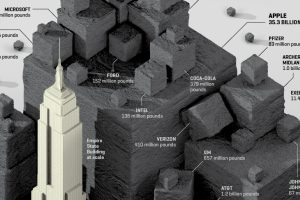
Visualizing the CO2 emissions saved by 56 of the Fortune 100 companies, expressed using the quantity of coal not burned. Read more
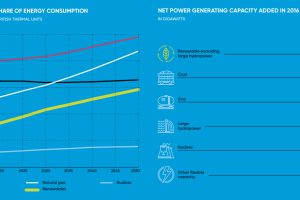
In 2016, more net capacity was added for clean energy than all other types combined. Who’s adding renewable capacity, and how much are they investing? Read more
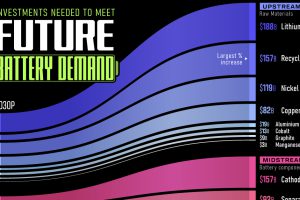
Investment in batteries is expected to surpass $1.6 trillion by 2040. Read more
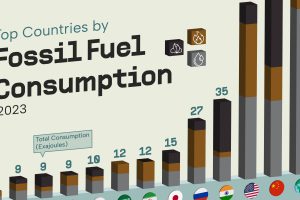
China and the U.S. account for nearly half of fossil fuel use. Read more