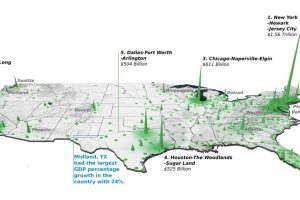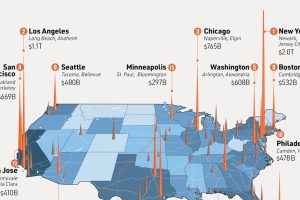
Did you know that the Top 20 metropolitan areas in the U.S. contribute 52% of the total country’s GDP? See how it breaks down by city in this 3d map. Read more

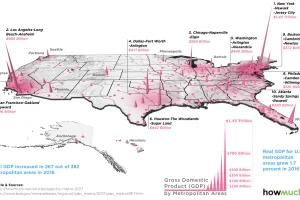
Which cities have the highest economic production in the country? This 3d map highlights GDP by metro area based on recent data. Read more

We ranked America’s 10 fastest growing housing markets, based on the growth of their housing stock from 2013 to 2022. Read more

Where are the world’s highest cities? This graphic ranks the world’s major urban centers by altitude above sea level. Read more

In this visual, we’ve ranked the top U.S. metropolitan areas in terms of their GDP. How does your city rank? Read more

This graphic uses data taken from latest official censuses and projections to rank the largest cities by population. Read more

