

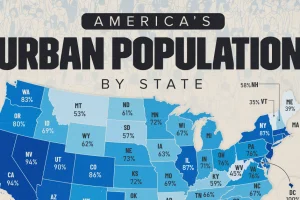
About 80% of the U.S. lives in cities. That’s 264 million people. But how does it vary per state? We investigate. Read more
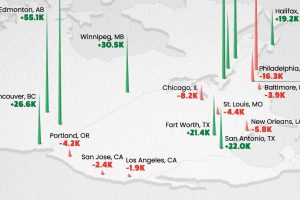
Toronto was the fastest-growing city in Canada and the U.S. in 2023, adding over 125,000 people to its population. Read more
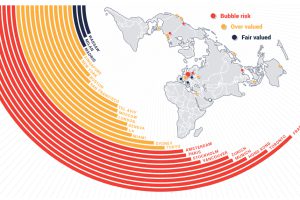
According to UBS, there are nine real estate markets that are in bubble territory with prices rising to unsustainable levels. Read more
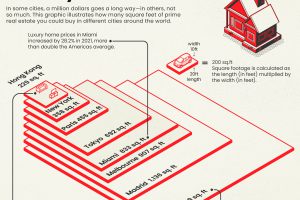
Is $1 million enough to buy you a luxury home? As this infographic shows, the answer varies greatly from city to city. Read more
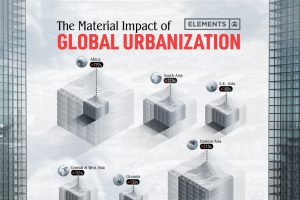
The world’s material consumption is expected to grow from 41 billion tonnes in 2010 to about 89 billion tonnes by 2050. This graphic shows the impact of urbanization. Read more
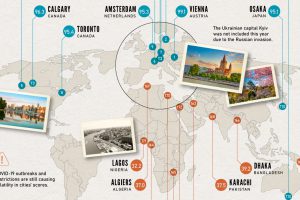
Which cities rank as the best places to live worldwide? This map reveals the world’s most and least livable cities. Read more
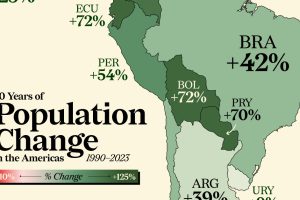
Nearly every country in the Americas has seen a population boom in the last three decades. Some have doubled in size. Read more

From New York to Damascus, this infographic uses EIU cost of living data to rank the world’s most and least expensive cities to live in Read more
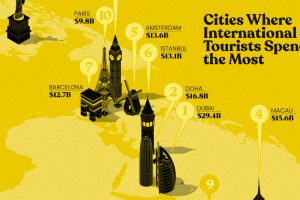
This infographic highlights the 10 cities where international travelers spend the most. In 2022, Dubai took top spot. Read more
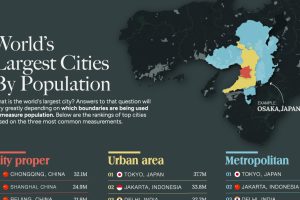
This graphic uses data taken from latest official censuses and projections to rank the largest cities by population. Read more