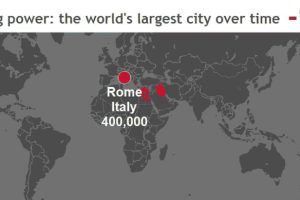
These stunning animations and interactive maps show the changing title for the world’s largest city, as well as the rapid pace of urbanization in today’s world. Read more
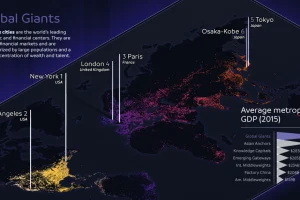
The world’s largest 123 cities generate an astonishing $36 trillion in GDP per year. This infographic breaks these global cities down into seven typologies. Read more
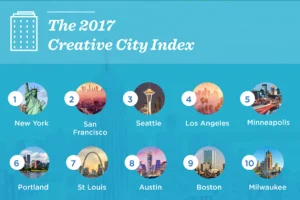
The creative economy is a vital contributor to economic health, but it’s a hard thing to measure. Here are some of the most creative cities in the U.S. Read more
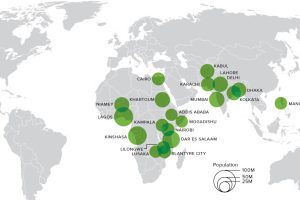
This animation shows big changes in the world’s most populous cities over the next 80+ years. Africa alone will hold 13 cities bigger than NYC by this time. Read more
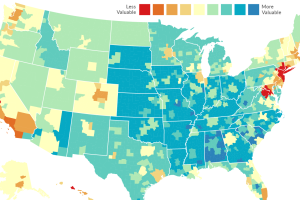
Every dollar spent is not equal. In some cities like NYC or SF, it will buy you far less – and in other places, a dollar has much more buying… Read more
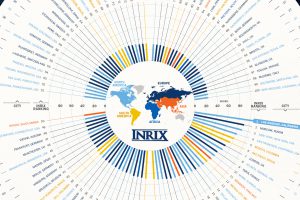
Which city has the ultimate distinction of having the world’s most horrific traffic? See this infographic to see the most congested cities globally. Read more
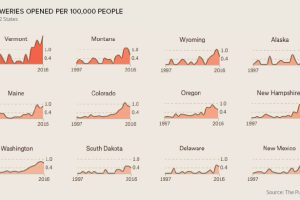
The craft beer boom is a nation-wide trend, but certain cities have an outsize influence on the industry – and beer lovers. Read more
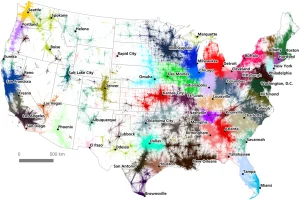
A massive commuter dataset and algorithmic approach have created a unique, new map of America’s megaregions. Read more
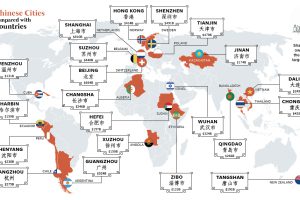
You’ve probably heard of Chinese cities like Beijing, Hong Kong, and Shanghai – but those actually only scratch the surface of China’s economic picture. Read more
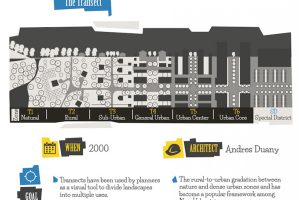
From garden cities to psychogeography, the 20th century saw a number of bold ideas that radically changed urban planning. Read more

