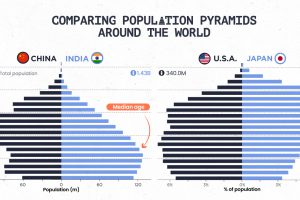
Population pyramids can show a country’s demographic advantages and challenges at a glance. See how different parts of the world stack up. Read more
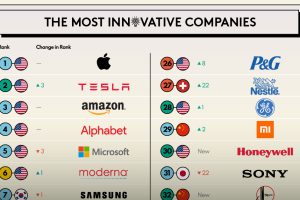
Which companies prioritize innovation the most? This infographic highlights BCG’s 2023 Most Innovative Companies ranking. Read more
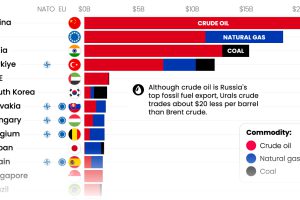
With Russia’s revenues from fossil fuel exports having declined significantly, which countries are still importing Russian fossil fuels? Read more
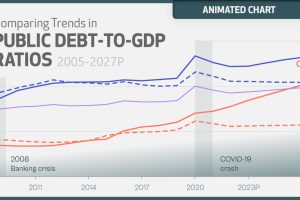
The surge in global debt poses significant risks to government balance sheets. Here’s where it’s projected to reach over the next five years. Read more
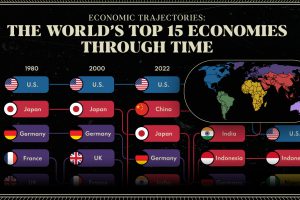
We provide a historical and predictive overview of the top economies in the world, including projections all the way to 2075. Read more
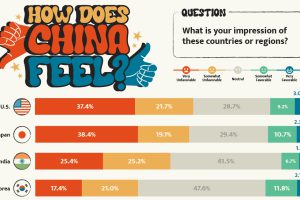
What is the Chinese public’s view of world powers? This visual breaks down Chinese sentiment towards other countries. Read more
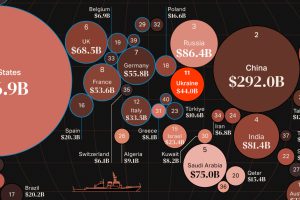
War in Europe has caused Ukraine’s military spend to jump up by 640%. How do the world’s largest military budgets compare? Read more
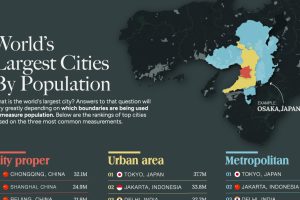
This graphic uses data taken from latest official censuses and projections to rank the largest cities by population. Read more
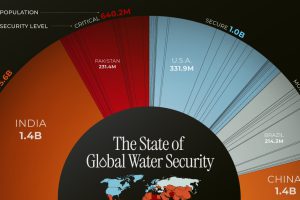
This chart highlights the different countries, and the number of people, facing water security issues around the world. Read more
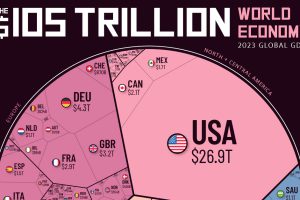
How much does each country contribute to the $105 trillion world economy in 2023, and what nations are seeing their nominal GDPs shrink? Read more

