

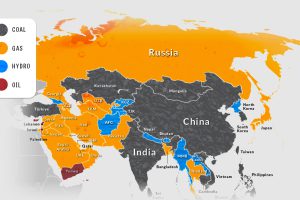
Asia is on its way to account for half of the world’s electricity generation by 2025. How is this growing demand currently being met? Read more
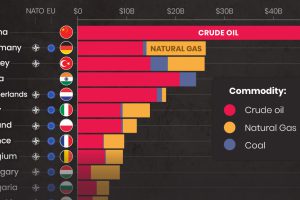
While Russia still makes billions from fossil fuel exports, revenues are declining. Here are the largest importers since the start of the invasion. Read more
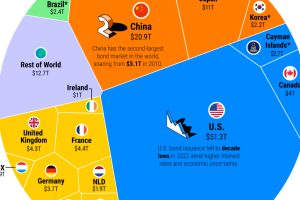
The global bond market stands at $133 trillion in value. Here are the major players in bond markets worldwide. Read more

In this graphic we explore the world’s declining fertility rate over the last 60 years and the disparity in fertility rates between nations Read more
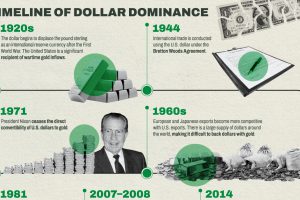
The U.S. dollar is the dominant currency in the global financial system, but some countries are following the trend of de-dollarization. Read more

As the market for low-emission solutions expands, China dominates the production of clean energy technologies and their components. Read more
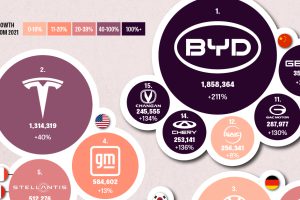
This graphic explores the latest EV production data for 2022, which shows BYD taking a massive step forward to surpass Tesla. Read more
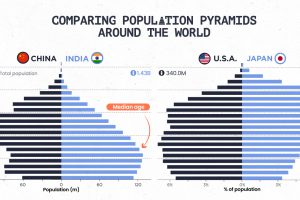
Population pyramids can show a country’s demographic advantages and challenges at a glance. See how different parts of the world stack up. Read more
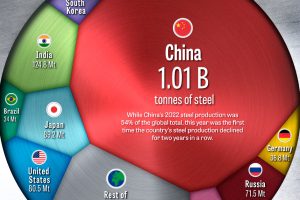
China has dominated global steel production the past few decades, but how did the country get here, and is its production growth over? Read more
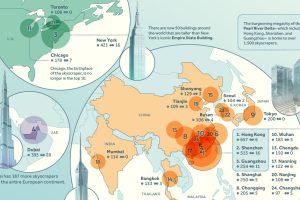
We rank the world’s leading cities with the most skyscrapers, highlighting China’s remarkable dominance in building vertically. Read more