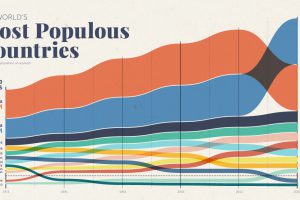
Over the past 50 years, the world’s population has doubled, and there have been big changes in the ranking of the world’s most populous countries Read more

The world’s most surveilled cities contain hundreds of thousands of cameras. View this infographic to see the data in perspective. Read more
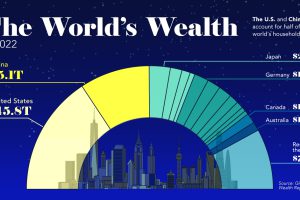
This visualization breaks down how household wealth is distributed around the world. Just 10 countries now account for 75% of total household wealth. Read more
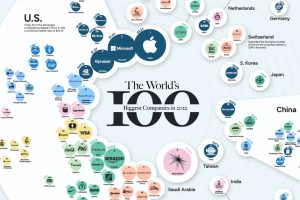
Who made it to the top? Here are the world’s most valuable public companies in 2022 as the year comes to an end. Read more
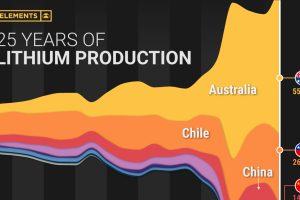
Lithium production has grown exponentially over the last few decades. Which countries produce the most lithium, and how how has this mix evolved? Read more
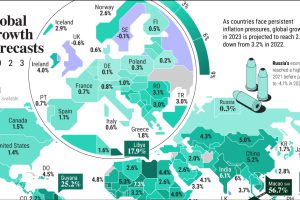
The global economy faces an uncertain future in 2023. This year, GDP growth is projected to be 2.9%—down from 3.2% in 2022. Read more
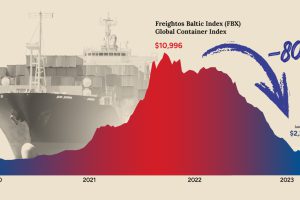
After a dramatic spike during the pandemic, shipping costs have now fallen back to Earth. What does that mean for shippers and the economy? Read more

This infographic breaks down battery manufacturing capacity by country in 2022 and 2027. Read more
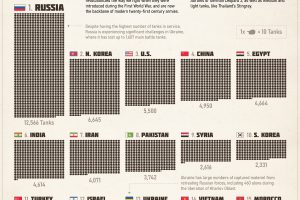
The tank remains the backbone of modern twenty-first century armies. This infographic shows what countries have the largest combat fleets. Read more
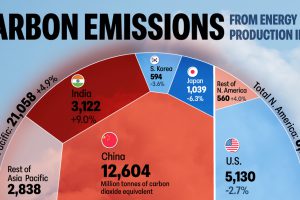
The energy sector is the main contributor of greenhouse gas emissions globally. Which countries’ energy sector emits the most CO2? Read more

