How did the European Debt Crisis begin? This video explains how countries in the Eurozone built up such troublesome debt. Read more
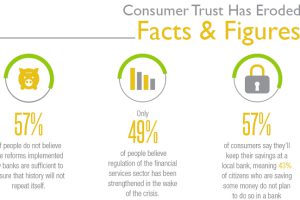
Consumer trust has eroded in the banking system, with only 32% of people trusting their retail bank. Why is trust at an all time low and how can it be… Read more
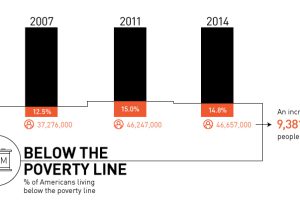
Is there really a recovery? Most recent data shows that there are 9.4 million more Americans in poverty than 2007, with growing inequality. Read more
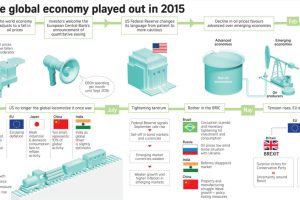
This infographic recaps economic events and sentiment in 2015. Should investors approach the new year with renewed optimism or brace for volatility? Read more
The global economic climate finally has composure, according to asset management firm Schroders. It may be the calm before the storm, though. Read more
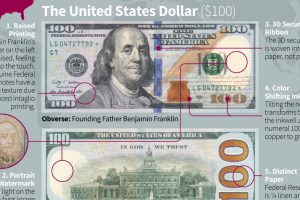
Breaking down the tech used in anti-counterfeiting features for 10 different currencies, from the U.S. Dollar to the Pound Sterling. Read more
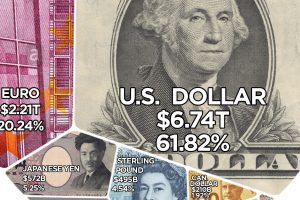
Here are the reserve currencies that the world’s central banks hold onto for a rainy day. Read more
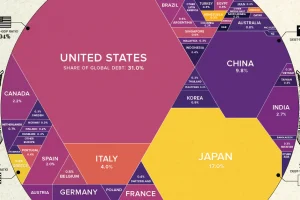
What share of government world debt does each country owe? See it all broken down in this stunning visualization. Read more
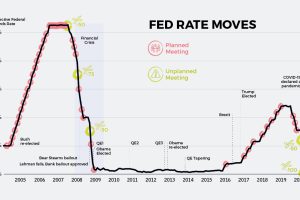
As interest rates continue their historic spiral downwards, the world’s central banks are running out of conventional tools to settle markets. Read more


