By popular demand from our audience, we show how the U.S. is gradually becoming a cashless society. Read more

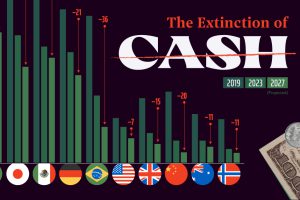
As credit cards and digital wallets increase in popularity, the world is seeing the death of cash as means of transaction. Read more

How do millennials spend their discretionary income in comparison to other groups? We dive into the latest survey results on millennial spending habits. Read more

It’s so much, that simply telling you wouldn’t convey the magnitude. That’s why we created this video, which visualizes how much money humans have created. Read more

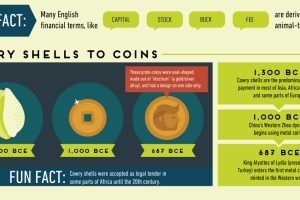
The history of money is filled with trial and error. Some experiments, such as precious metals, stood the test of time – while others have crashed and burned. Read more

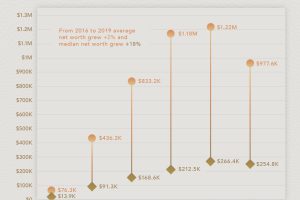
How much is the average American worth at different ages? This chart reveals the average net worth by age in the U.S. Read more

As top institutions advise for cautious deployment of capital next year, what assets and strategies are in their investing playbook in 2024? Read more

From ETFs to private equity funds, we show the top investments that financial advisors used with their clients over 2023. Read more

