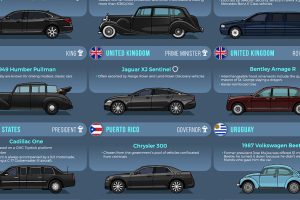
From bombproof luxury to vintage style, heads of state choose a wide variety of vehicles to get around. Read more
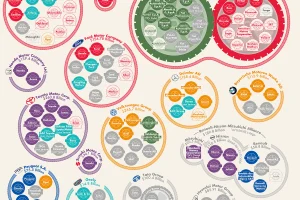
This massive infographic shows the 15 corporations that make the most cars, their annual revenues, and the brands owned by each automaker. Read more
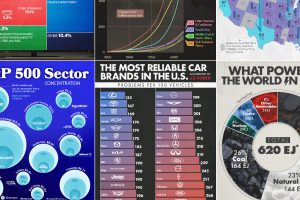
We round up the most popular, most discussed, and most liked visualizations of the month on Voronoi, our new data storytelling platform. Read more

We visualize how far popular EV models will take you on real-world routes between major cities, and which are the most cost effective. Read more

This graphic displays the number of registered electric vehicles (EVs) per 100,000 people in each state as of June 2024. Read more
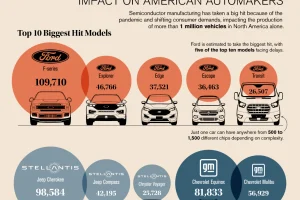
As the global chip shortage causes delays in automotive production, what models and manufacturers are being hit the hardest? Read more

America’s major cities are some of the most traffic congested in the world. Click to find out which ones made the top 10. Read more
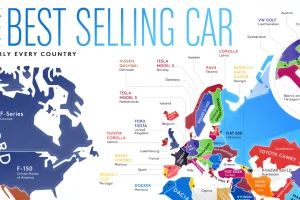
From American trucks to European sedans, this map shows the best-selling vehicles in the world. Read more

From Fords in the Midwest to Toyotas on the coasts, here are the best selling vehicles in America, visualized by state. Read more


