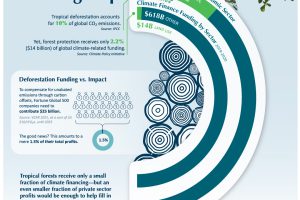
Deforestation accounts for 10% of global CO2 emissions, yet receives just a small slice of climate funding. See why closing this funding gap is necessary to combat climate change. (Sponsored) Read more
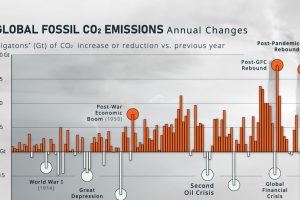
How much do global CO₂ emissions change on a year-to-year basis? Here, we show the annual rate of change in emissions since 1900. Read more
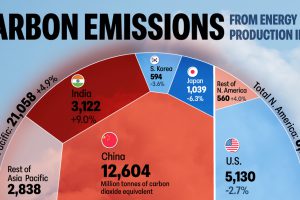
The energy sector is the main contributor of greenhouse gas emissions globally. Which countries’ energy sector emits the most CO2? Read more
After rapid industrialization in the 1990s, mass urbanization is driving demand even higher. Read more
We look at carbon emissions of electric, hybrid, and combustion engine vehicles through an analysis of their life cycle emissions. Read more
We visualize Earth’s history through the geological timeline to reveal the planet’s many epochs, including the Anthropocene. Read more
Comparing average Scope 1 emission intensities by sector according to an analysis done by S&P Global Inc. Read more

Which foods are linked with high CO2 emissions and high water use? We look at the environmental impacts of food production in this chart. Read more
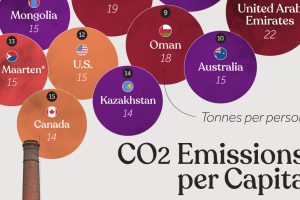
Which countries rank the highest in per capita carbon emissions, and how do they impact the world’s total carbon emissions? Read more


