
The world lost the equivalent of almost ten soccer fields of tropical forest per minute last year. Read more
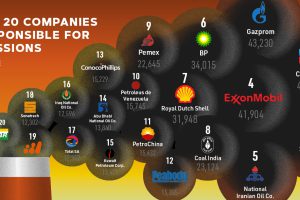
Since 1965, over ⅓ of the world’s cumulative carbon emissions can be traced back to just 20 fossil fuel companies. Who are the biggest contributors? Read more
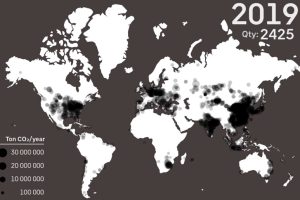
See every major coal power plant ever commissioned on this animation, which covers a time period from 1927 until 2019. Read more
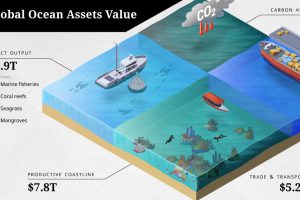
The ocean economy is under threat. How are human activities impacting the sustainable use of our ocean assets, valued at over $24 trillion? Read more
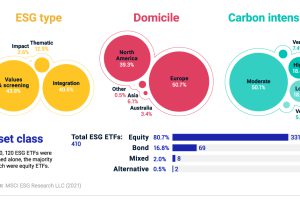
Sustainable ETFs surged to $150B in 2020—25x higher than in 2015. What makes up the sustainable ETF universe? Read more
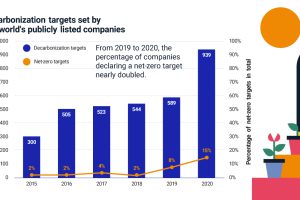
More companies are declaring net-zero emissions targets, but where can they start? Find out the steps companies and investors can take. Read more
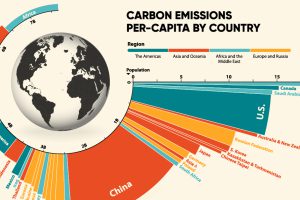
33.6 Gt of CO2 was emitted across the world in 2019. Here we visualize the global per capita CO2 emissions by country and region. Read more
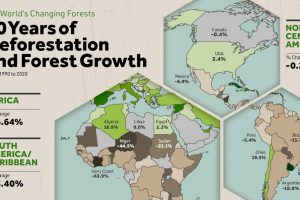
Where are the world’s forests still shrinking, and where are they seeing net gains? We map deforestation by country between 1990-2020. Read more
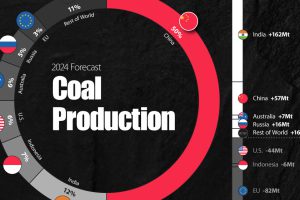
Coal came under scrutiny for its high carbon emissions at COP26, but many countries are forecasted to increase coal production until 2024. Read more


