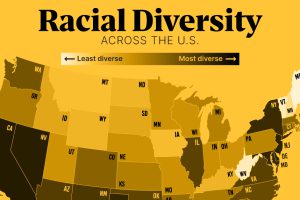
In this graphic, we show the most diverse states in the U.S. based on the Census Bureau’s Diversity Index. Read more

To offer perspective on the population of U.S. states, this map compares them to countries that share similar population sizes. Read more
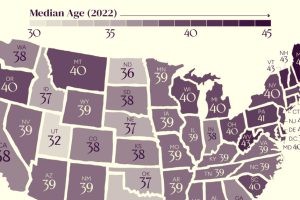
The U.S. might have a median age of 39, but the median age by state ranges from the low 30s to the mid 40s. Read more
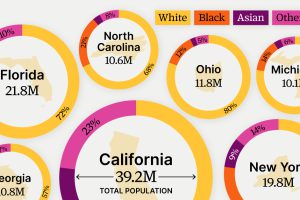
Here’s how racial diversity breaks down across the 10 largest U.S. states by population—from California to Michigan. Read more

Here’s where workers earn the highest minimum wage in America as 22 states implement wage increases in 2024. Read more
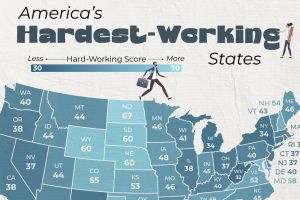
Analyzing performance across ten weighted metrics, reveals the vertical strip of states that work the hardest. Read more
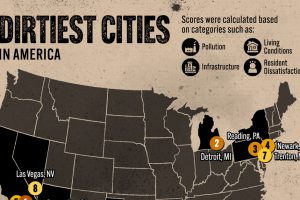
San Bernardino County in California is home to two of the 10 dirtiest cities in the United States: San Bernardino city and Ontario. Read more

