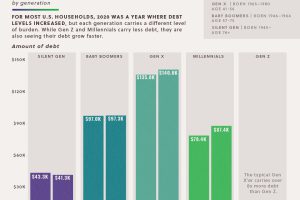
The majority of U.S. households saw debts rise in 2020. This data looks at the growth in household debt and the existing debt pile, by generation Read more
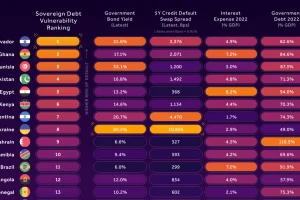
In this infographic, we examine new data that ranks the top 25 countries by their default risk. Read more

Foreign investors hold $7.3 trillion of the national U.S. debt. These holdings declined 6% in 2022 amid a strong U.S. dollar and rising rates. Read more
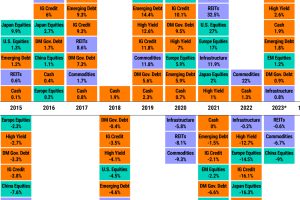
Asset classes vary widely by returns so far in 2023. Which ones are the best-performing, and is a bull market on the horizon? Read more

Endowment funds represent the investment arms of nonprofits. See the worlds top 50, which collectively have over $1 trillion in assets. Read more
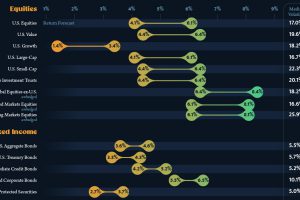
This infographic visualizes 10-year annualized forecasts for both equities and fixed income using data from Vanguard. Read more

As top institutions advise for cautious deployment of capital next year, what assets and strategies are in their investing playbook in 2024? Read more
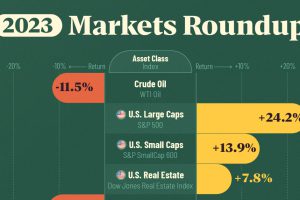
Between equities, real estate, commodities, bonds, and emerging markets, we track which major asset class ended the year on a positive note. Read more

From ETFs to private equity funds, we show the top investments that financial advisors used with their clients over 2023. Read more
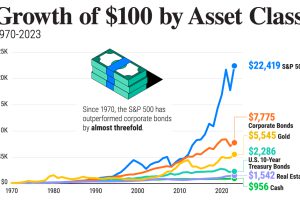
In this graphic, we show asset class returns across U.S. equities, bonds, real estate, gold and cash since 1970. Read more

