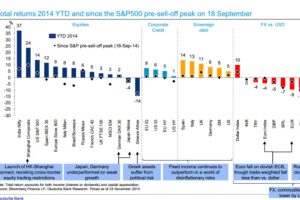
This Deutsche Bank chart shows the performance of every major asset class YTD so far in 2014. Read more
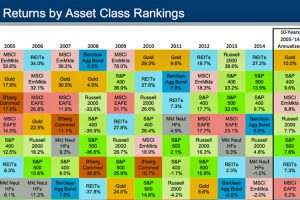
Chart showing historical returns by asset class from 2004-2014. How do investments in bonds, equities, real estate, gold, and commodities compare over time? Read more
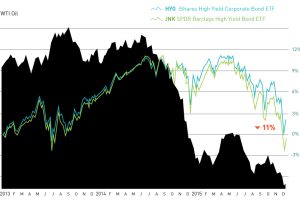
The month of December so far has seen a mini-meltdown in the junk bond market. The culprit? Fringe oil and gas producers that are struggling with low prices. Read more
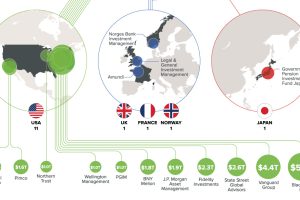
Only 15 companies hold more than $1 trillion in assets under management (AUM) – and the vast majority of them are based in the U.S. Read more
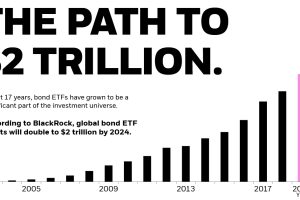
Bonds are a staple in every portfolio, but up until recently were hard to own. Here’s how bond ETFs changed that, reaching $1 trillion in global AUM. Read more
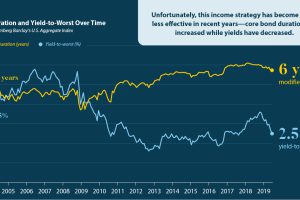
Traditional longer-terms bonds are no longer as effective—so which additional income strategies should investors be considering? Read more

Today, the share of Americans’ financial assets that are invested in public stocks is near all-time highs. Read more
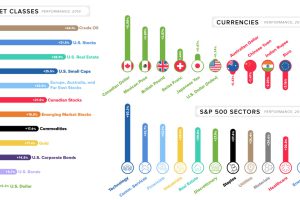
This quick graphic summary breaks down the final market numbers for 2019, looking at everything from currencies to broad asset classes. Read more
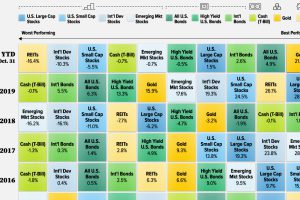
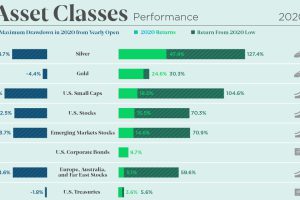
What are the best-performing investments in 2020, and how do previous years compare? This graphic shows historical returns by asset class. Read more


