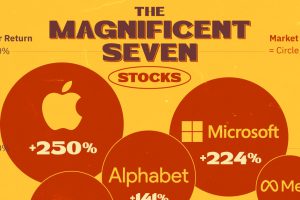
Amazon’s shipping costs have surged to over $150 billion – a number that has almost doubled since the start of the pandemic. Read more
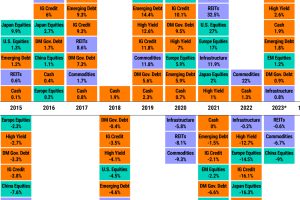
Asset classes vary widely by returns so far in 2023. Which ones are the best-performing, and is a bull market on the horizon? Read more
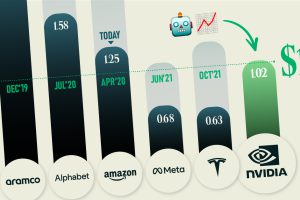
America’s biggest chipmaker Nvidia has joined the trillion dollar club as advancements in AI move at lightning speed. Read more
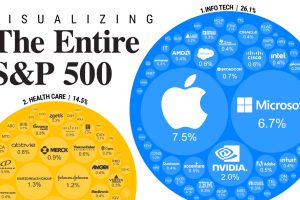
S&P 500 companies make up $34 trillion in market value combined. This graphic shows how they break down by weight and sector. Read more
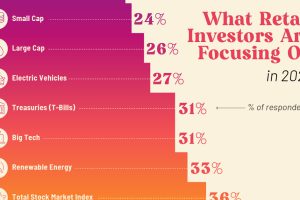
What key themes and strategies are retail investors looking at for the rest of 2023? Preview: AI is a popular choice. Read more

Google’s dominant search engine market share has prompted the U.S. Justice Department to file a lawsuit over anticompetitive practices. Read more
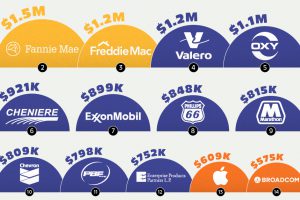
Which companies and sectors generate the most profit per employee? We rank the top 25 companies in the U.S. based on this interesting metric. Read more


