

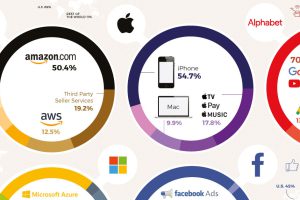
The big five tech companies generate almost $900 billion in revenues combined, more than the GDP of four of the G20 nations. Here’s how they earn it all. Read more

This graphic charts the American dairy industry’s shift in milk production from small commercial farms to fewer, larger farms. Read more
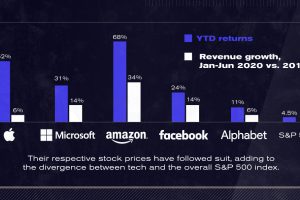
After a strong start to 2020, U.S. tech giants continue to advance to unprecedented highs. The Big Five now account for 25% of the S&P 500. Read more

Nearly half the world has tapped into the social media universe. Monthly Active Users (MAUs) quantifies the success of these giant platforms. Read more
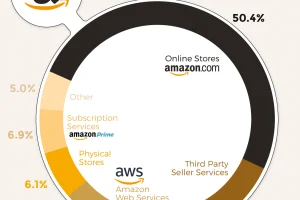
In 2019, Amazon generated $281 billion in total revenue—but where does all this revenue come from? Here’s a breakdown of how Amazon makes its money. Read more

By embracing uncertainty and making timely pivots, we visualize the bizarre origin stories of the most successful tech companies today. Read more
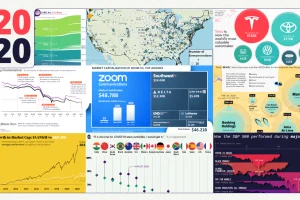
These 20 charts, maps, and visualizations help capture what happened in a tumultuous year around the globe. Read more
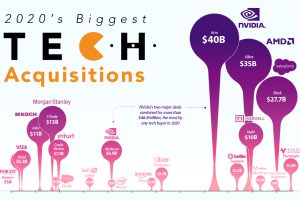
In a challenging year for most, many large tech companies have prospered and grown. We visualize the year’s biggest tech mergers and acquisitions. Read more

Now that the initial newness has faded, which places get the most use of ChatGPT? A BCG survey has answers. Read more

The media consumption landscape in 2021 is shifting. Time spent on media continues to spike, with mobile challenging for the top spot Read more