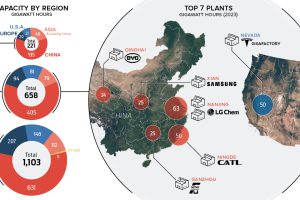
In just a decade, there will be the equivalent lithium-ion battery production capacity of 22 Tesla Gigafactories, with most of that being in China. Read more
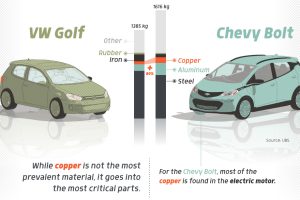
Have you ever wondered how much copper is in an electric vehicle? This infographic shows the metal’s properties as well as the quantity of copper used. Read more

This graphic displays the number of registered electric vehicles (EVs) per 100,000 people in each state as of June 2024. Read more
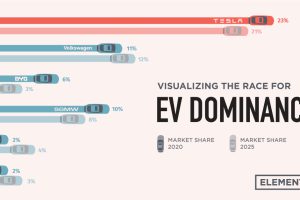
Tesla was the first automaker to hit a $1 trillion market cap, but other electric car companies have plans to unseat the dominant EV maker. Read more
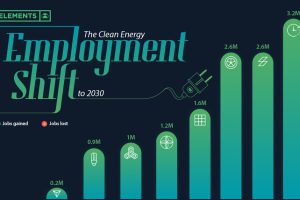
Will the clean energy transition create jobs, or will jobs be lost? Here is projected employment growth in clean energy and related sectors to 2030. Read more
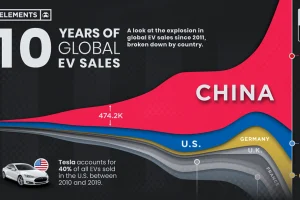
Global EV sales have grown exponentially, more than doubling in 2021 to 6.8 million units. Here’s a look at EV sales by country since 2011. Read more
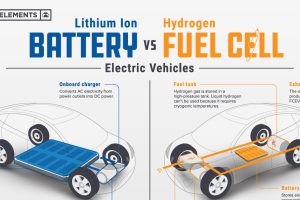
Understand the science behind hydrogen fuel cell vehicles, and how they differ from traditional EVs. Read more
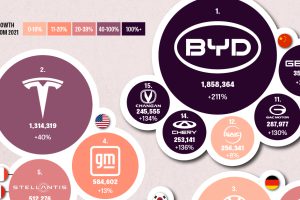
This graphic explores the latest EV production data for 2022, which shows BYD taking a massive step forward to surpass Tesla. Read more


