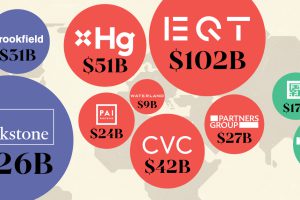
This map visualizes the leading private equity firms of major countries, ranked by capital raised over the past five years. Read more
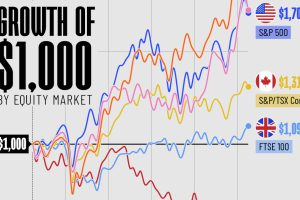
In this graphic, we’ve visualized stock market growth by country over the past five years using major indices. Read more
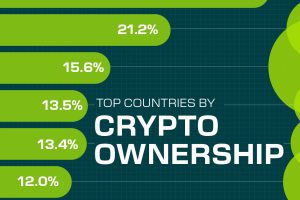
While the U.S. is a major market for cryptocurrencies, two countries surpass it in terms of their rates of crypto ownership. Read more

We visualized the latest data on Berkshire Hathaway’s portfolio to see what Warren Buffett is invested in. Read more

The wealth of American Millennials hit historic highs after the COVID-19 pandemic. Read more
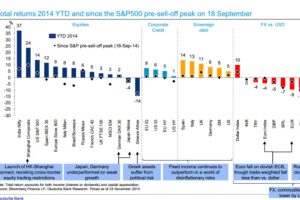
This Deutsche Bank chart shows the performance of every major asset class YTD so far in 2014. Read more
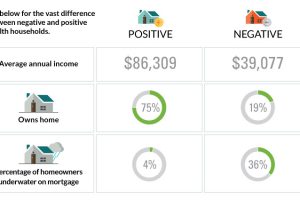
The differences between America’s poorest homes – those with negative wealth – and their positive counterparts are stark and numerous. Read more
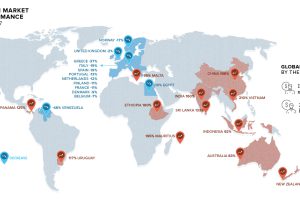
Wealth is not stagnant. Here’s how it has shifted over the last decade from 2007-2017, including the winners and losers of the shift in wealth globally. Read more


