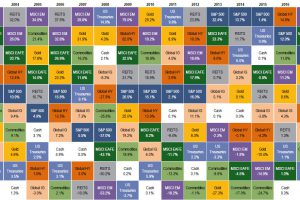
This infographic compares 14 different conventional and alternative asset classes during five times of distress. See the history of crisis investing here. Read more

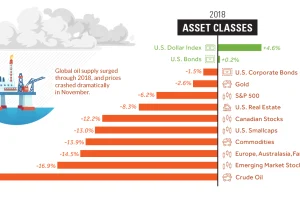
Investors saw a sea of red in 2018 – here’s a visual recap of how markets performed, including the big winners and losers from a volatile year. Read more

Over the past decade, the top 1% of U.S. households’ portion of wealth has gone from 28.6% to 31.2%. Read more

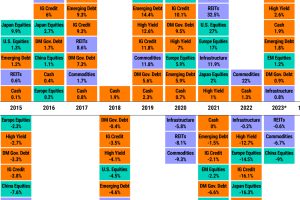
Asset classes vary widely by returns so far in 2023. Which ones are the best-performing, and is a bull market on the horizon? Read more


