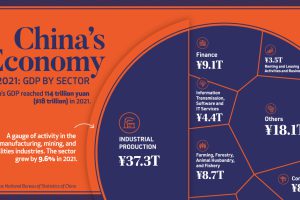
China’s economy reached a GDP of 114 trillion yuan ($18 trillion) in 2021, well above government targets. What sectors drove that growth? Read more
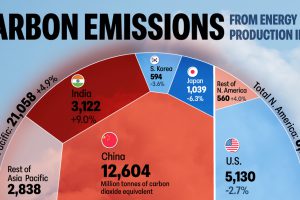
The energy sector is the main contributor of greenhouse gas emissions globally. Which countries’ energy sector emits the most CO2? Read more
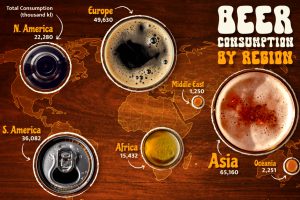
Which region has led global beer consumption for 15 consecutive years? This graphic shows the top beer-drinking regions worldwide. Read more
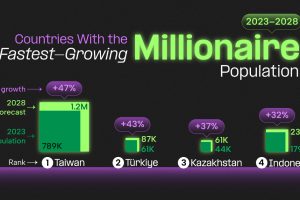
All of these countries are expected to have millionaire population growth rates of over 20% between 2023-2028. Read more
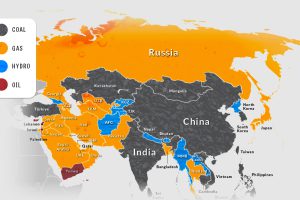
Asia is on its way to account for half of the world’s electricity generation by 2025. How is this growing demand currently being met? Read more
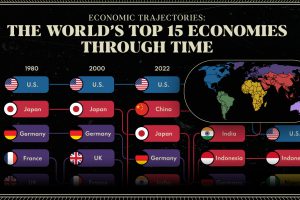
We provide a historical and predictive overview of the top economies in the world, including projections all the way to 2075. Read more
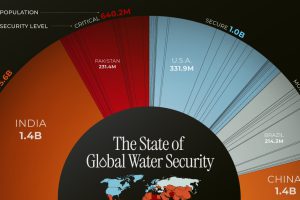
This chart highlights the different countries, and the number of people, facing water security issues around the world. Read more
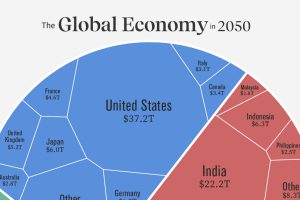
Asia is expected to represent the world’s largest share of real GDP in 2050. See how this all breaks down in one chart. Read more
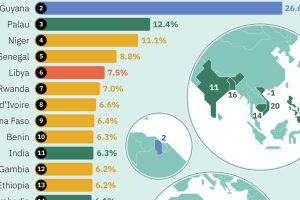
This graphic uses the latest IMF projections to rank the world’s top 20 fastest growing economies for 2024. Read more

The global middle class is expected to grow by 113 million people in 2024. We visualize this growth by country and region. Read more

