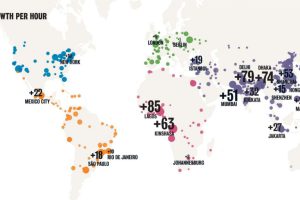
Rapid urbanization is creating a vastly different world. These maps show the world’s fastest growing cities, as well as how things have chanced since 1950. Read more
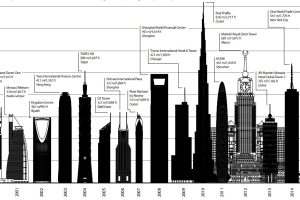
These visualizations show how the tallest skyscraper of 2015 compares to other years, as well as other buildings completed last year. Read more
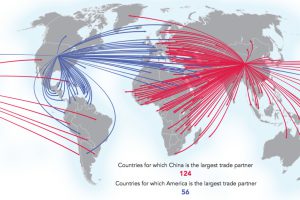
These four maps tell the story of Chinese trade dominance and ambitions. See how Beijing’s sphere of influence is rapidly changing. Read more
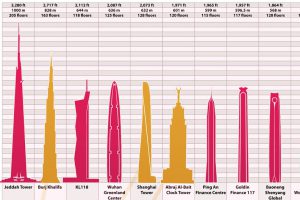
The ranking of the world’s tallest buildings has shifted dramatically since the start of the 20th century. See the evolution of this list over nearly 100 years. Read more
Countries which host large diasporas from around the world rank highly on this list of places sending the most remittances abroad. Read more
India’s population density averages at around 1,100 people per square mile. But that number can jump much higher in certain cities. Read more
The world’s most populous countries, China and India, top the countries with the largest rice production in 2022. Read more
Just three regions have contributed 79% of global cumulative GHG emissions since 1850. See where they are in this graphic. Read more

Where are the top 100 universities in the world located? We look at the World University Rankings 2024 to find out. Read more
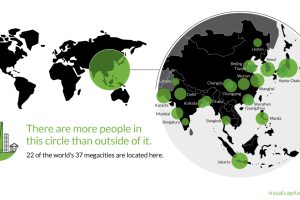
That’s right – nearly 4 billion people live inside the circle on this world map, including 22 of the world’s 37 megacities. Read more

