
Only 12 apps have ever reached the coveted 1 billion active user mark. This timeline visualization shows how long it took each one to get there. Read more
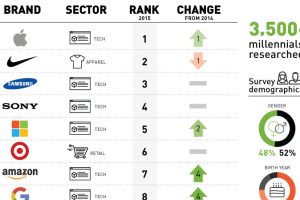
By 2020, millennials will account for 30% of all retail sales, worth $1.4 tn. Here’s the top 10 millennial brands according to a survey of 3,500 millennials Read more
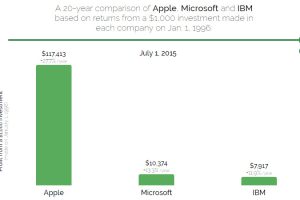
Going back 20 years, which stock would you buy? It turns out to be not even close between Apple and Microsoft. Read more
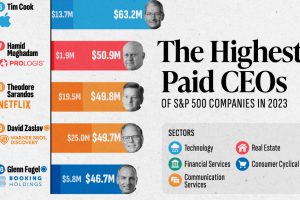
As median S&P 500 executive compensation hits record levels, we show the highest paid CEOs in America in 2023. Read more
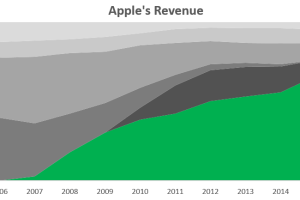
With iPhone sales making up over 60% of revenue, investors are becoming increasingly worried that Apple is a one trick pony. Read more

The ‘garage-to-riches’ story shows the true power that an idea can have. See the multi-billion dollar firms that were started in garages in this infographic. Read more
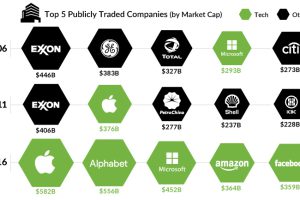
What are the largest companies by market cap, and how have they changed over the years? This chart shows them, while also presenting a broader narrative. Read more

This infographic breaks down the 34 components that make your iPhone work. See where each part inside an iPhone comes from, and who makes it. Read more


