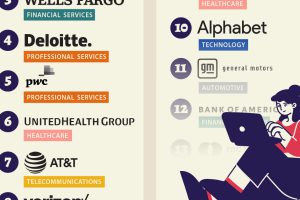
We visualized the results of a LinkedIn study on the best U.S. companies to work for in 2024. Read more
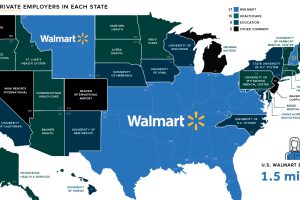
On this map of biggest employers in each state, there’s one regional trend that stands out the most – the broad blue expanse of Walmart country. Read more
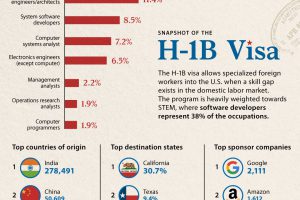
This infographic covers all the key charts and data for the H1-B visa, which grants foreign skilled workers employment in the U.S. Read more
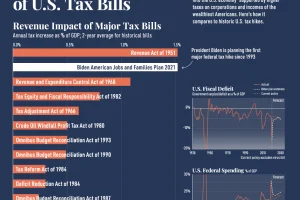
President Biden is set to inject trillions into the economy through higher taxes. Here’s how the tax hikes compares to historic U.S. tax increases. Read more

How bad are the current layoffs in the tech sector? This visual reveals the 20 biggest tech layoffs since the start of the pandemic. Read more
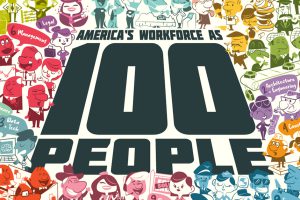
Reimagining all 200 million of the American workforce as 100 people: where do they all work, what positions they hold, and what jobs they do? Read more
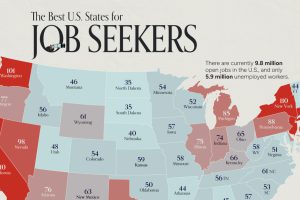
On average, there are 75 workers available for every 100 job openings across the country. Here’s how it varies by state. Read more

Will your job be in less demand in the future? See which occupations have the most projected job cuts from 2023 to 2033. Read more

