Changing consumer expectations have created a harsh environment for traditional brands to operate in—will tech companies make them obsolete? Read more
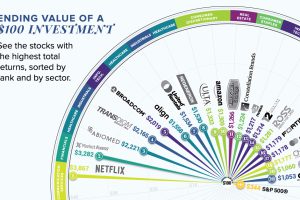
This graphic reveals the best-performing stocks over the last 10 years, and shows how much an initial $100 investment would be worth today. Read more
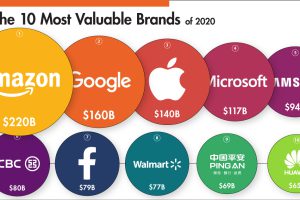
This infographic ranks some of the world’s biggest companies by brand value in 2020 and visualizes the movers and shakers over the past year. Read more
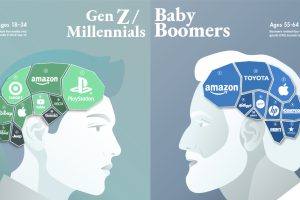
Can a brand transcend time and be all things to all people? This graphic seeks to find out by visualizing the most loved brands by generation. Read more
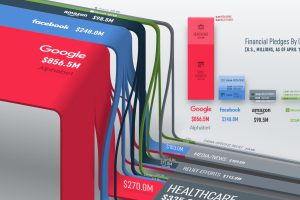
Breaking down the $1.25 billion in funding announced by Big Tech companies to fight the pandemic. Read more
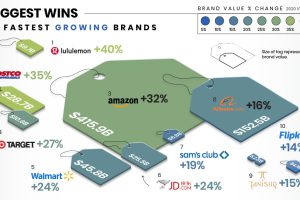
This infographic illustrates how the fastest growing and declining retail brands are attempting to stay relevant in the pandemic economy. Read more
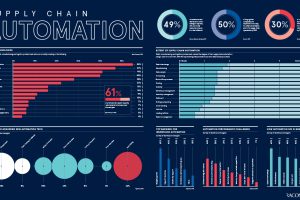
As COVID-19 disrupts global supply chains, we take a look at how industries are investing in automation—and what this is tells us about the future. Read more
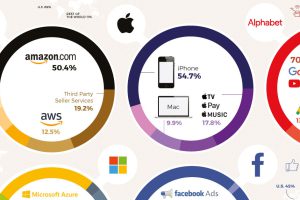
The big five tech companies generate almost $900 billion in revenues combined, more than the GDP of four of the G20 nations. Here’s how they earn it all. Read more
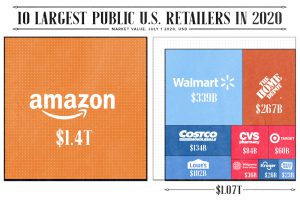
Amazon’s valuation has grown by 2,830% over the last decade, and the tech giant is now worth more than the other 9 largest U.S. retailers, combined. Read more


