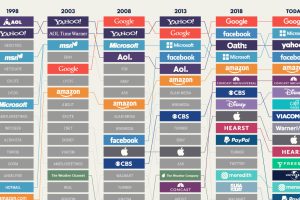
A lot has changed since Yahoo and AOL were the homepages of choice. This visualization looks at the largest internet giants in the U.S. since 1998. Read more
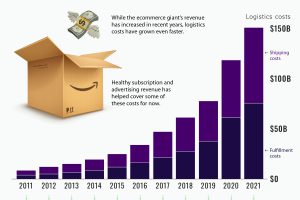
Amazon’s shipping costs have surged to over $150 billion – a number that has almost doubled since the start of the pandemic. Read more

How much has the world’s land use changed over the last 10,000 years, and how have forests been impacted? Read more
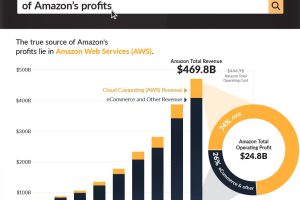
Amazon is best known for its sprawling ecommerce empire, but three-quarters of the company’s profits actually come from cloud computing. Read more
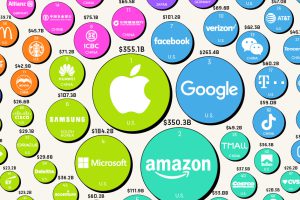
A strong brand is extremely lucrative when leveraged properly. Here’s a look at the most valuable brands in 2022, according to Brand Finance. Read more
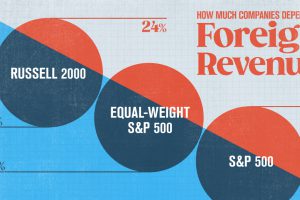
Foreign revenue significantly impacts the bottom line for corporate America, but its share of sales varies widely among major stock indexes. Read more
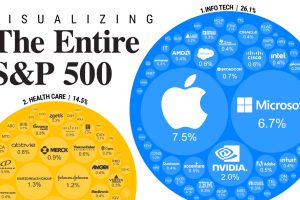
S&P 500 companies make up $34 trillion in market value combined. This graphic shows how they break down by weight and sector. Read more


