

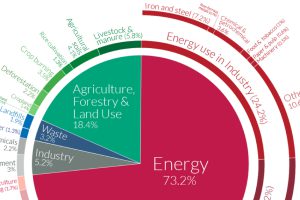
World emissions have reached almost 50 billion tonnes of greenhouse gases (GHGs) and counting. Which major sectors do they originate from? Read more
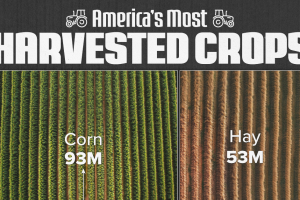
The area devoted to growing the three top crops is bigger than the size of Texas. But even on that podium there’s only one king. Read more
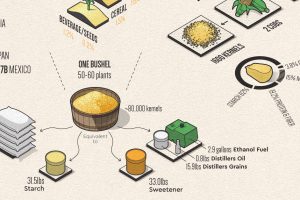
Corn has many uses that make modern life possible. This infographic breaks down U.S. corn usage in 2020. Read more
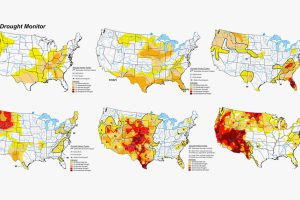
The Western U.S. is no stranger to droughts. But this year’s is one of the worst yet. Here’s a historical look at U.S. droughts since 1999. Read more
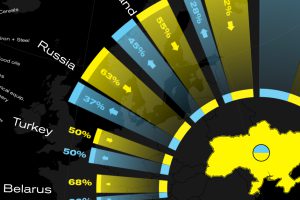
This graphic visualizes Ukraine’s top international trading partners and the country’s most exported and imported products in 2020. Read more
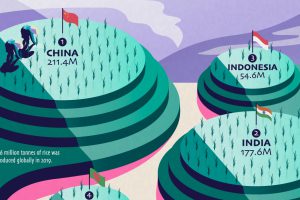
Over half of the world’s population lives on rice as a staple food, but just a few countries dominate global rice production. Read more
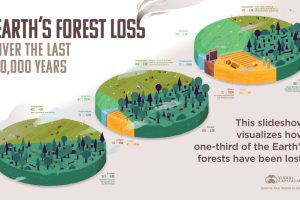
How much has the world’s land use changed over the last 10,000 years, and how have forests been impacted? Read more
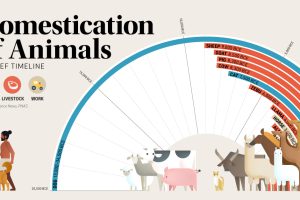
This graphic shows a timeline of when 15 different animals became domesticated, based on archaeological findings. Read more
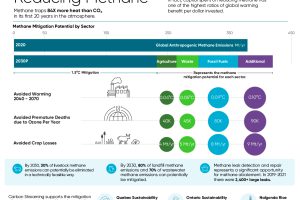
Methane emissions contribute to over half of net global warming. Where do the greatest opportunities lie for methane abatement? Read more
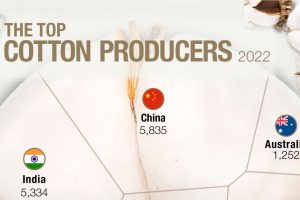
As the most-used natural fiber, cotton has become the most important non-food agricultural product. Read more