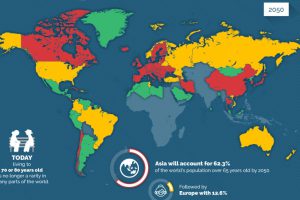
The percentage of the global population that is 65+ will double from 10% to 20% by 2050, creating potential economic headwinds especially for millennials. Read more
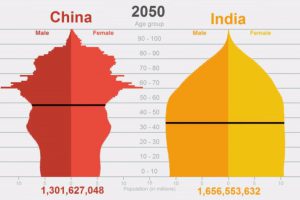
Unintended effects of China’s population control policies, the challenges of Chinese demographics, and a new population paradigm where India sits up top. Read more
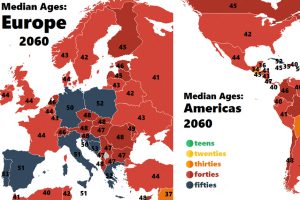
How fast are countries in Europe and the Americas aging? These colorful animations show how the median age is projected to change up until the year 2060. Read more
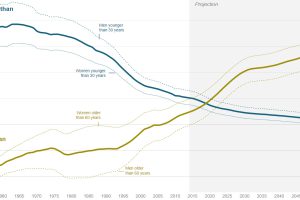
By 2019, the country will have a higher 60+ year old population than its 30 and under crowd. This series of charts shows the demographic outlook for Germany. Read more
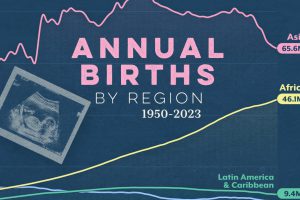
After decades Asia’s population boom is slowing down. However, birth trends indicate there’s a new population hotspot. Read more
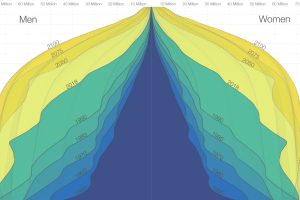
The world is in the midst of a notable demographic transition. Here’s how the world population pyramid will change as we close in on the year 2100. Read more
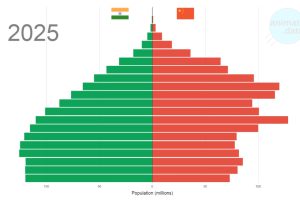
The world’s two most populous countries have some economic similarities, but China and India are also diverging in one key area: demographics. Read more
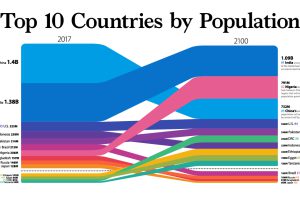
New estimates show that world population may begin shrinking in coming years. We visualize this and how country populations will change by 2100. Read more
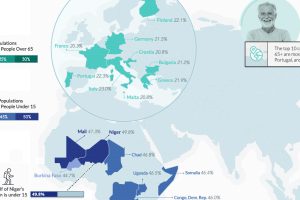
Higher life expectancies and lower fertility rates are reshaping global demographics, but vast regional differences remain. Where are the youngest and oldest countries in the world? Read more
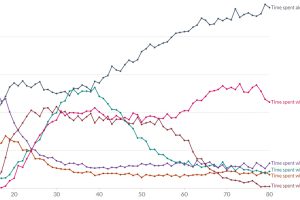
Ever wondered who Americans spend the most time with? This chart assesses how many minutes per day Americans spend with different people. Read more

