

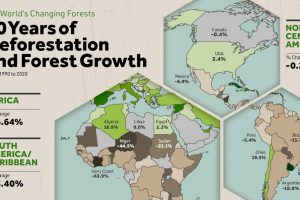
Where are the world’s forests still shrinking, and where are they seeing net gains? We map deforestation by country between 1990-2020. Read more
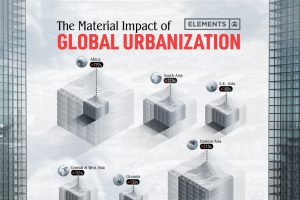
The world’s material consumption is expected to grow from 41 billion tonnes in 2010 to about 89 billion tonnes by 2050. This graphic shows the impact of urbanization. Read more
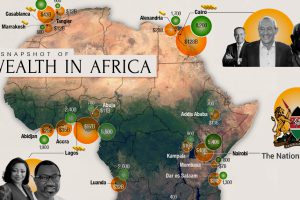
Total private wealth in Africa is now estimated to be US$2.1 trillion. This map looks at where all that wealth is concentrated around the continent. Read more
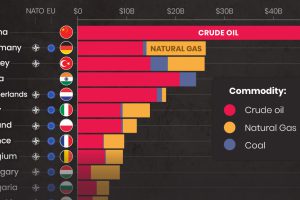
While Russia still makes billions from fossil fuel exports, revenues are declining. Here are the largest importers since the start of the invasion. Read more
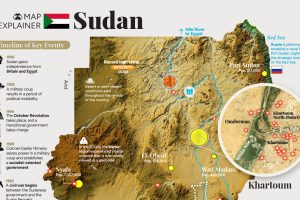
This comprehensive map explainer covers both key facts about Sudan, as well as information on the violent power struggle unfolding there Read more
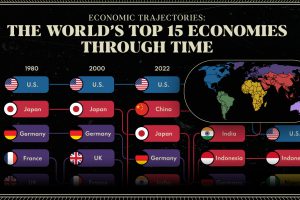
We provide a historical and predictive overview of the top economies in the world, including projections all the way to 2075. Read more
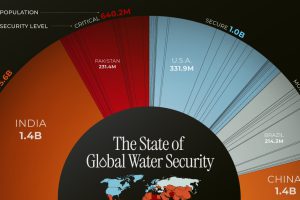
This chart highlights the different countries, and the number of people, facing water security issues around the world. Read more
This graphic uses the latest IMF projections to rank the world’s top 20 fastest growing economies for 2024. Read more
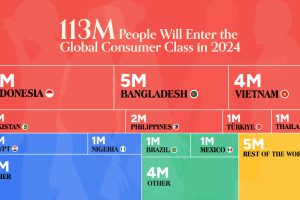
The global middle class is expected to grow by 113 million people in 2024. We visualize this growth by country and region. Read more
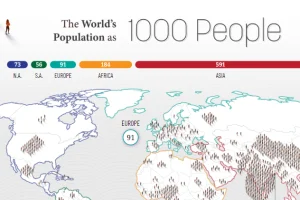
How would all the people in the world be spread out if there were only 1,000 people on Earth? This interactive map examines the breakdown. Read more