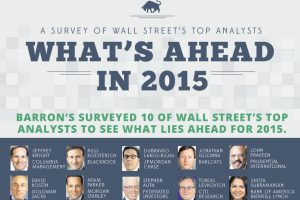
The results of Barron’s poll of top Wall Street analyst predictions for 2015. Read more

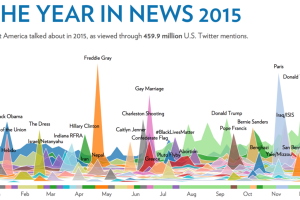
This visualization analyzes 459.9 million tweets over the course of the year to show the magnitude and timing of trending news stories in 2015. Read more

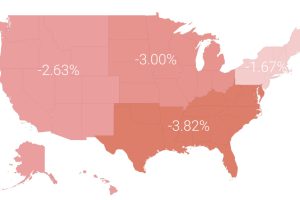
In a volatile market in 2015, the average investor lost 3.1%. In today’s post, we break this performance down by region, profession, and age. Read more

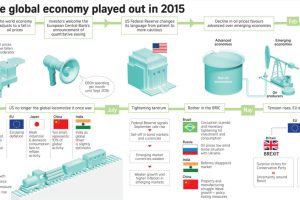
This infographic recaps economic events and sentiment in 2015. Should investors approach the new year with renewed optimism or brace for volatility? Read more

