Ranked: The Debt Burden of Major Economies
This was originally posted on our Voronoi app. Download the app for free on iOS or Android and discover incredible data-driven charts from a variety of trusted sources.
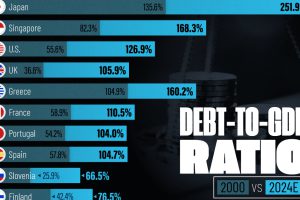
Global debt hit a new high of $312 trillion in the first half of 2024, fueled by government borrowing in America and China.
Despite this massive buildup, governments in advanced and emerging economies are showing little initiative to address their escalating debt levels. Concerningly, global government borrowing is projected to rise from $92 trillion today to $440 trillion in 2050.
This graphic shows the debt burden score of major world economies, based on analysis from Ray Dalio’s Great Powers Index 2024.
Methodology
To evaluate the debt conditions of leading economies, Dalio looked at the following factors:
- Debt relative to assets
- External and internal surpluses and deficits
- Debt service costs relative to GDP
- Level of debt in domestic currency or foreign currency
- Debt held by citizens versus foreigners
- Credit rating
Overall, debt burden ratings are expressed as z-scores, with a z-score of zero representing the dataset’s average.
G7 Countries Face High Debt Burdens
Below, we show the debt burden score of 24 major nations at a time of surging global debt:
| Ranking | Country | Debt Burden Score 2024 |
Change Since 2022 |
|---|---|---|---|
| 1 | 🇸🇦 Saudi Arabia | 1.7 | -0.2 |
| 2 | 🇩🇪 Germany | 0.8 | 0.0 |
| 3 | 🇮🇩 Indonesia | 0.7 | 0.1 |
| 4 | 🇰🇷 South Korea | 0.6 | 0.1 |
| 5 | 🇸🇬 Singapore | 0.4 | -1.2 |
| 6 | 🇲🇽 Mexico | 0.4 | 0.1 |
| 7 | 🇮🇳 India | 0.3 | -0.2 |
| 8 | 🇹🇷 Türkiye | 0.2 | 0.7 |
| 9 | 🇨🇭 Switzerland | 0.2 | -0.2 |
| 10 | 🇿🇦 South Africa | 0.2 | 0.0 |
| 11 | 🇷🇺 Russia | 0.0 | -1.2 |
| 12 | 🇳🇱 Netherlands | 0.0 | 0.0 |
| 13 | 🇨🇳 China | -0.2 | -0.2 |
| 14 | 🇨🇦 Canada | -0.3 | 0.0 |
| 15 | 🇧🇷 Brazil | -0.3 | -0.1 |
| 16 | 🇪🇺 Eurozone | -0.4 | 0.2 |
| 17 | 🇦🇺 Australia | -0.4 | 0.3 |
| 18 | 🇮🇹 Italy | -0.5 | 0.0 |
| 19 | 🇦🇷 Argentina | -0.8 | 0.1 |
| 20 | 🇪🇸 Spain | -0.9 | 0.2 |
| 21 | 🇯🇵 Japan | -0.9 | 0.1 |
| 22 | 🇫🇷 France | -1.0 | -0.2 |
| 23 | 🇬🇧 UK | -1.9 | -0.1 |
| 24 | 🇺🇸 U.S. | -1.9 | 0.0 |
Burdened by high debt-to-GDP ratios, G7 nations face some of the worst debt conditions, with the U.S. and UK at the bottom.
Both countries are grappling with aging populations and weaker projected real GDP growth, further compounding their mounting debt. Recently, the UK government projected that debt-to-GDP could triple by 2070 based on current policies. Since 2000, the country’s debt has already grown by threefold.
In China, local governments, which rely heavily on the property market sector for revenues, are contending with $5.6 trillion in debt. While property income contributed to more than 40% of local government revenues in 2020, it has since declined amid a deteriorating property market sector.
In contrast, Saudi Arabia ranks at the top with a public debt-to-GDP ratio of just 24%. While this is up from 3% in the previous decade, it remains far below the EU average of 82% and America’s 132% in 2023. Approximately three-quarters of Saudi government revenue still comes from oil, but the country is making significant investments to diversify into new industries including sports and tourism by 2030.
Learn More on the Voronoi App 
To learn more about this topic from an economic growth perspective, check out this graphic on real GDP growth projections across leading economies over the next decade.


