A Heatmap of America’s Truckers
In 2021, the U.S. imported $2.8 trillion worth of goods.
This incredible quantity of goods—along with much of what is produced domestically—is handled by the country’s 1.8 million truckers, which represents the 14th most common occupation nationally.
To see how these truckers are distributed across the nation, we’ve visualized data from the U.S. Bureau of Labor Statistics (BLS) to create two separate heat maps.
Key Findings from the Data
The relative density of each state’s truckers is measured by their location quotient.
This represents the ratio of truckers in a state compared to the national average (both as a % of total employment). For example, if truckers made up 10% of a state’s employment, and the national average was 2%, the location quotient for that state would be 5.
This data is listed in the table below.
| State | Location Quotient |
|---|---|
| Arkansas | 2.4 |
| Nebraska | 2.2 |
| Wyoming | 2.1 |
| Iowa | 2 |
| North Dakota | 1.9 |
| Tennessee | 1.6 |
| Mississippi | 1.6 |
| Idaho | 1.5 |
| Wisconsin | 1.4 |
| Indiana | 1.4 |
| Alabama | 1.3 |
| South Dakota | 1.3 |
| West Virginia | 1.3 |
| Oklahoma | 1.3 |
| Texas | 1.3 |
| Maine | 1.3 |
| Missouri | 1.2 |
| Kentucky | 1.2 |
| Utah | 1.2 |
| Pennsylvania | 1.1 |
| Kansas | 1.1 |
| New Mexico | 1.1 |
| Georgia | 1.1 |
| Ohio | 1.1 |
| Michigan | 1.1 |
| Montana | 1.1 |
| South Carolina | 1.1 |
| North Carolina | 1.1 |
| New Jersey | 1 |
| Minnesota | 1 |
| Illinois | 1 |
| Oregon | 0.9 |
| Louisiana | 0.9 |
| Virginia | 0.9 |
| New Hampshire | 0.9 |
| Arizona | 0.8 |
| Delaware | 0.8 |
| Florida | 0.8 |
| Vermont | 0.8 |
| Colorado | 0.8 |
| Washington | 0.8 |
| Nevada | 0.8 |
| Maryland | 0.7 |
| California | 0.7 |
| Connecticut | 0.6 |
| Rhode Island | 0.6 |
| Alaska | 0.6 |
| Massachusetts | 0.6 |
| Hawaii | 0.6 |
| New York | 0.5 |
| District of Columbia | 0.1 |
There are four states with a location quotient of two or more: Arkansas, Nebraska, Wyoming, and Iowa. This means that their trucker workforce (as a % of total employment) is at least double the national average.
On the other hand, California and New York have some of the lowest location quotients in the country. Trucking companies have been competing fiercely to attract drivers in these areas, but with limited success.
At a time when the whole American population is aging, truck drivers tend to be older than average. The work is stressful, lonely, exhausting and long plagued by a pay system that can make drivers feel they can’t get ahead of the game.
– Los Angeles Times
To entice more young people to enter the industry, New York recently created a truck driver training program for 18-20 year olds. Some have voiced their concerns about safety, though few alternatives exist. In October 2021, the American Trucking Association (ATA) announced that the national driver shortage had reached a record-breaking 80,000.
A Different Perspective
The location quotient is an effective measure because it controls for the differences in each state’s population. Seeing the raw data, though, can still add useful perspective.
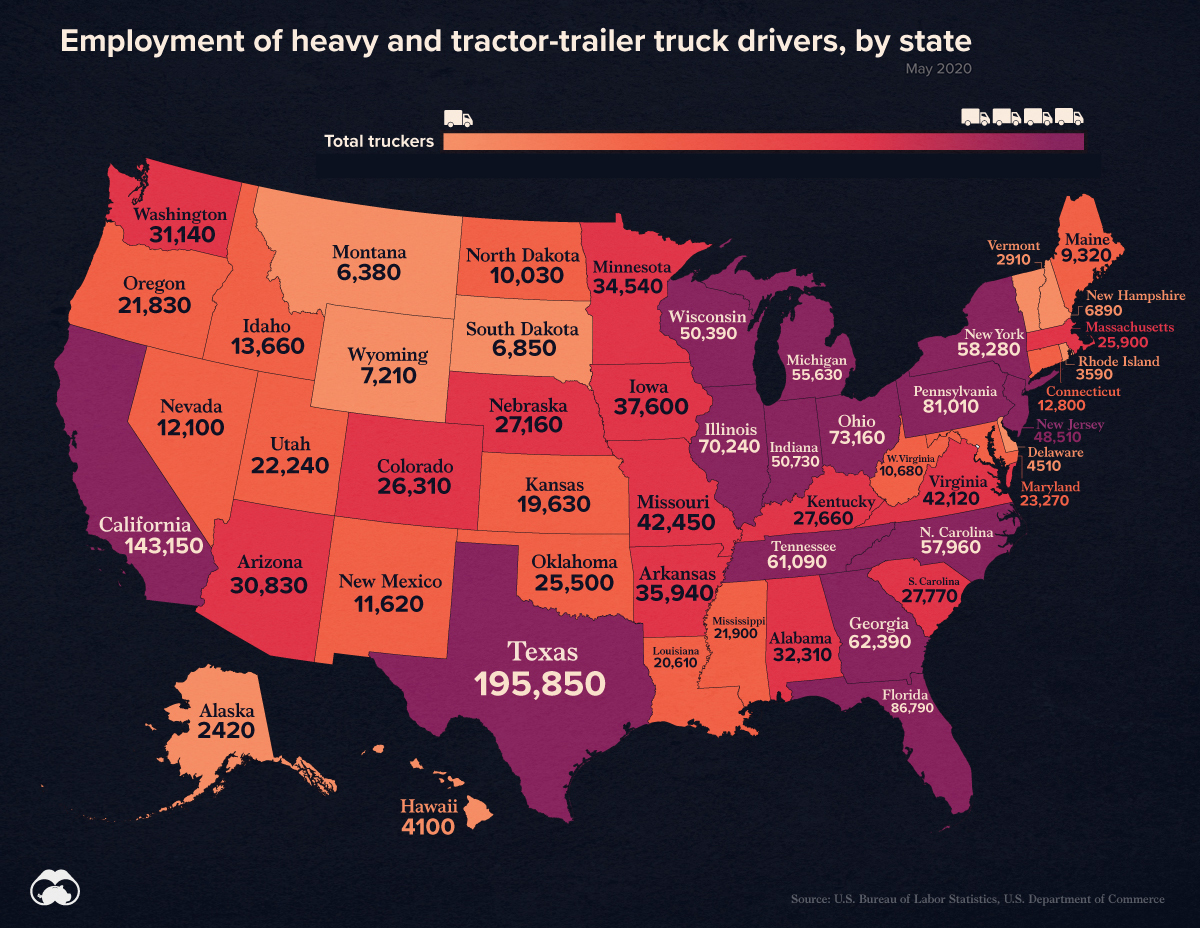
The following image shows the number of trucker’s in each state. As a reminder, the national total is 1.8 million.

With these numbers, we can gain a more practical understanding of the location quotient. For instance, California has the second highest number of truckers, but it’s dwarfed by the state’s massive population of 40 million.
Occupation Outlook
The BLS expects employment of truck drivers to grow by 6% from 2020 to 2030, which is close to the national average for all jobs. Based on total employment of 1.8 million, this would translate to 108,000 new openings.
Whether these openings will be filled is an entirely different story.
In the American Trucking Association’s latest report, analysts estimate that the industry will need to recruit 1 million drivers just to replace retiring drivers, or those that leave voluntarily.


