Mapped: How Many Hours Europeans Work Each Week
This was originally posted on our Voronoi app. Download the app for free on iOS or Android and discover incredible data-driven charts from a variety of trusted sources.
There’s an old joke: are you working hard, or hardly working? “Hard work” is difficult to measure, but it is possible to know who’s working the longest.
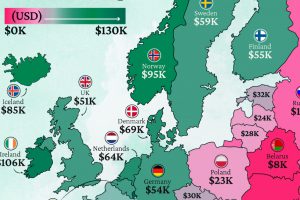
This heatmap visualizes the average hours Europeans work each week by country, as sourced from Eurostat’s Labor Force Survey (2023). The dataset covers employed persons aged 20–64 in a “main occupation” and includes full and part time work.
The Balkans Work the Longest in Europe
Less wealthy countries of Europe (by per capita GDP) tend to have longer work weeks. For example, people in the Balkans—including Türkiye, Serbia, Bosnia & Herzegovina, Greece, and Romania—all put in an average of 40+ hours a week at their main jobs.
| Rank | Country | Average Weekly Hours Worked (2023) |
|---|---|---|
| 1 | 🇹🇷 Türkiye | 44 |
| 2 | 🇷🇸 Serbia | 42 |
| 3 | 🇧🇦 Bosnia & Herzegovina | 41 |
| 4 | 🇬🇷 Greece | 40 |
| 5 | 🇷🇴 Romania | 40 |
| 6 | 🇵🇱 Poland | 39 |
| 7 | 🇧🇬 Bulgaria | 39 |
| 8 | 🇨🇾 Cyprus | 39 |
| 9 | 🇱🇻 Latvia | 38 |
| 10 | 🇱🇹 Lithuania | 38 |
| 11 | 🇭🇷 Croatia | 38 |
| 12 | 🇸🇮 Slovenia | 38 |
| 13 | 🇨🇿 Czechia | 38 |
| 14 | 🇭🇺 Hungary | 38 |
| 15 | 🇵🇹 Portugal | 38 |
| 16 | 🇸🇰 Slovakia | 38 |
| 17 | 🇲🇹 Malta | 37 |
| 18 | 🇪🇪 Estonia | 36 |
| 19 | 🇪🇸 Spain | 36 |
| 20 | 🇮🇸 Iceland | 36 |
| 21 | 🇨🇭 Switzerland | 36 |
| 22 | 🇮🇹 Italy | 36 |
| 23 | 🇫🇷 France | 36 |
| 24 | 🇸🇪 Sweden | 36 |
| 25 | 🇮🇪 Ireland | 36 |
| 26 | 🇱🇺 Luxembourg | 35 |
| 27 | 🇧🇪 Belgium | 35 |
| 28 | 🇫🇮 Finland | 35 |
| 29 | 🇩🇰 Denmark | 34 |
| 30 | 🇩🇪 Germany | 34 |
| 31 | 🇳🇴 Norway | 34 |
| 32 | 🇦🇹 Austria | 34 |
| 33 | 🇳🇱 Netherlands | 32 |
| N/A | 🇪🇺 EU (2020) | 36 |
Note: Figures rounded.
In contrast, those in the Netherlands work 32 hours per week on average. This disparity between Eastern and Western Europe is not new. Data from 2008 reflects largely the same trends.
Another find in the Labor Force Survey is how weekly working hours differ by occupation. Those in agriculture, forestry, and fishery have the longest workweeks (44 hours).
| Rank | Occupation | Average Weekly Hours Worked (2023) |
|---|---|---|
| 1 | 🌾 Agricultural, forestry & fishery | 44 |
| 2 | 💼 Managers | 42 |
| 3 | 🪖 Armed forces | 40 |
| 4 | 🔧 Trades | 38 |
| 5 | 🏭 Plant and machinery operators | 38 |
| 6 | 🔬 Technicians | 35 |
| 7 | 👩🏫 Professionals | 35 |
| 8 | 🛎️ Service and sales | 34 |
| 9 | 🖇️ Clerical support | 33 |
| 10 | 🔤 Elementary occupations | 31 |
Note: Figures rounded. Occupational average work hours accessible when customizing filters in source dataset.
When cross-referencing both datasets, some correlations emerge. For example, in Türkiye and Serbia, the two longest-working nations in Europe, nearly 20% of the workforce is employed in agriculture.
Similarly, Bosnia (3rd) and Romania (5th) also have roughly the same distribution (20%) of the workforce in agriculture.
Meanwhile, Greece’s average hours are about to go up: the government has introduced a six-day workweek for certain industries, in a bid to boost productivity.


