For American retailers, Christmas comes a month earlier.
Starting in late-November, the holiday shopping season officially kicks into high gear – and it’s the beginning of a month-long stretch that can either make or break retailers.
Black Friday is the shotgun start for this mad scramble of consumerism. And whether you are waiting in line to get a Turbo-Man doll, or you are constantly refreshing your browser window for the latest deal on Amazon, it’s a spectacle all the same.
Black Friday Numbers
Today’s infographic comes to us from AppInstitute, and it breaks down the numbers behind Black Friday, the centerpiece of the shopping extravaganza for retailers in the United States.

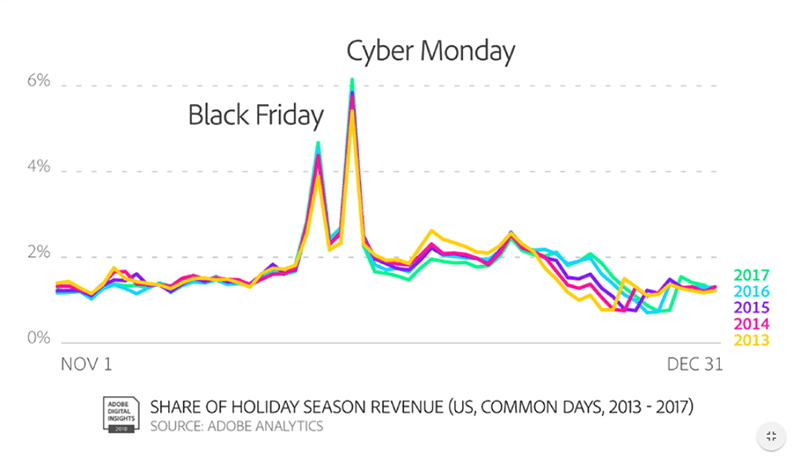
In totality, the holiday season generated $688 billion of revenue for retailers in the United States in 2017 – and $108.2 billion of this came from online purchases, which are seeing double-digit growth each year.
Impressively, about 15% of all online holiday revenue comes in the four-day span between Black Friday and Cyber Monday. The two days (Black Friday, Cyber Monday) are the two highest volume online shopping days of the year.

Source: Adobe
Online or Offline
Do shoppers take advantage of deals at home or in store?
It appears to be a mix of both, according to comprehensive data from Adobe for the 2017 shopping season:
- 16% shopped entirely in stores
- 29% shopped mostly in stores, and a little online
- 26% shopped equally in stores and online
- 20% shopped mostly online, and a little in stores
- 9% shopped entirely online
This means for most people, shopping is an omni-channel experience – they are comparing options in their heads between online (desktop, mobile) and offline channels.
An Even Bigger Day For Online Sales
While Black Friday is an impressive kickoff day for online and offline sales, there is an even bigger one-day online equivalent in China.
On Black Friday, online sales total about $5 billion – this is just a drop in the bucket compared to Alibaba’s Single’s Day, which sold $30.8 billion in a 24-hour period on November 11, 2018.
On Single’s Day in 2018, it took fewer than 90 seconds to hit $1 billion in online sales.


