How Does the Recent Oil Slump Compare?
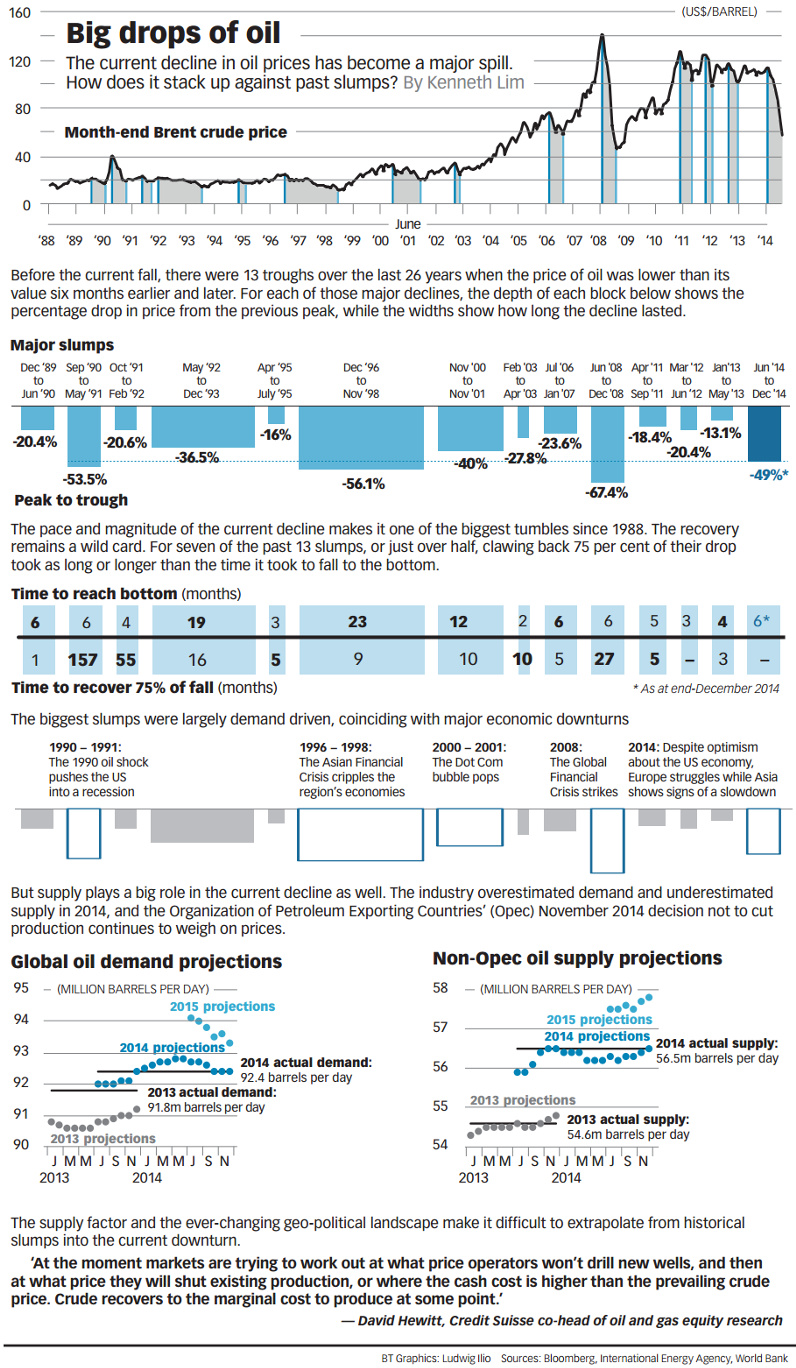
There’s no question that the recent slump in oil prices is historical in both its extent and global implications. But how does it compare to other famous oil slumps in history?
From June 2014 until the end of the year, crude dropped 49% overall. It turns out it is a big decline, but nothing that trumps the storied slumps of 1990-91, 1996-98, or late 2008. During the Financial Crisis, oil dropped over 67% in the last six months of 2008, before recovering in a big way with the rest of commodities.
While oil had a strong rally of recent in January, yesterday it had its largest one day drop in recent months of -8.7% due to oil inventories reaching 80 year highs.
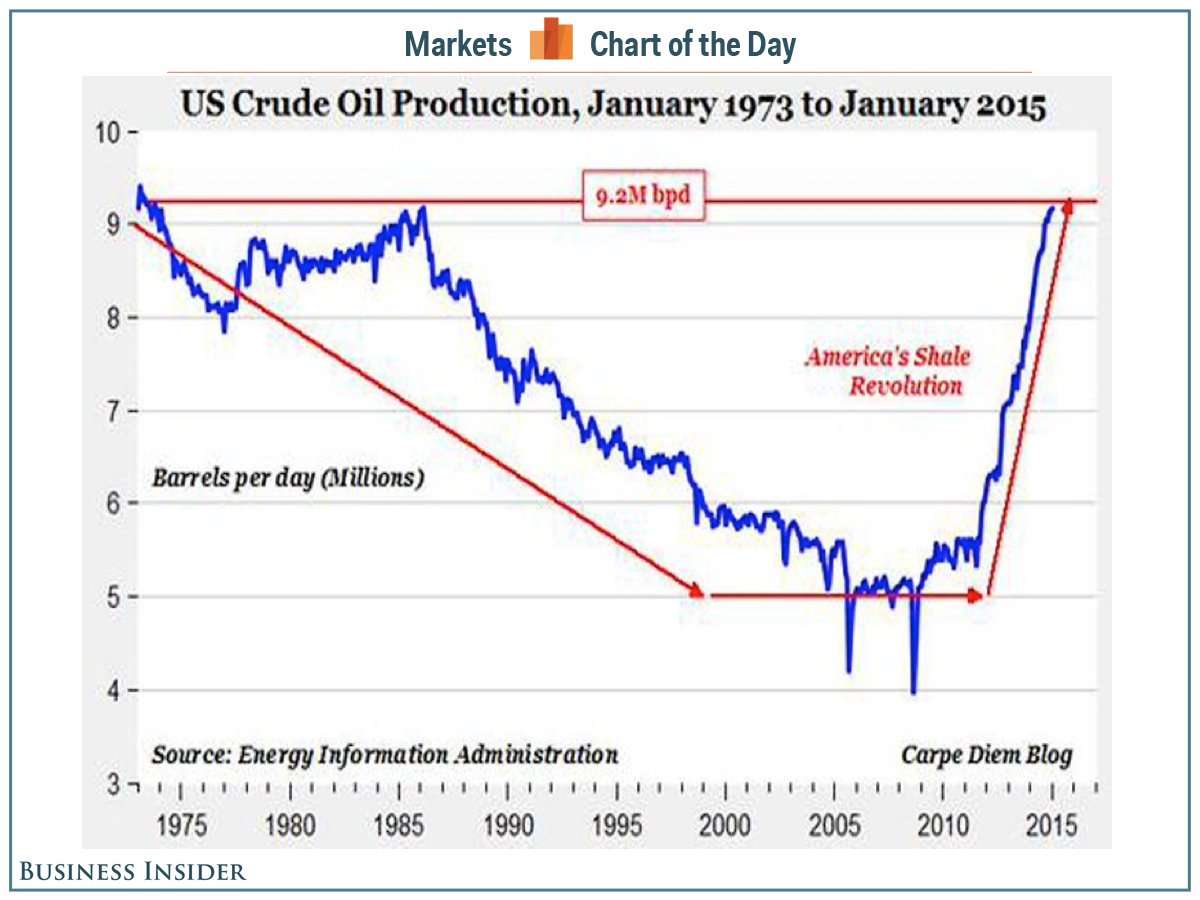
It’s no wonder – look at recent US production. Business Insider’s Chart of the Day shows that there is no sign of slowdown here at all.

Original graphic from: Business Times


