How Closely is Your State Economy Tied to Canada?
With negotiations around NAFTA continuing on into this week, many Americans are rightfully wondering how major changes to the deal could impact their lives.
Discussions are still early, and it’s tough to predict the exact policies that will be affected until negotiations reach their peak. However, until that point, there is one simple barometer that can give you an idea of how you may be affected: how much business does your state do with Canada, and how much is with Mexico?
States Tied to Canada
Today’s visualization from HowMuch.net focuses specifically on how close each state economy is tied to Canada.
Using a flow diagram, it breaks down $544.9 billion of bilateral trade into the imports and exports of states, ranked by the total amount of goods sent or received from their neighbors to the north.
Here’s a breakdown of the states that export the most to Canada, both in percentage terms and dollars:
| Exports to Canada, by % | Exports to Canada, by $ | |||||
|---|---|---|---|---|---|---|
| Rank | State | Exports (%) | Rank | State | Exports ($) | |
| #1 | North Dakota | 82.5% | #1 | Michigan | $23.7B | |
| #2 | Maine | 47.5% | #2 | Texas | $20.0B | |
| #3 | Montana | 46.7% | #3 | Ohio | $19.2B | |
| #4 | Michigan | 43.3% | #4 | California | $16.2B | |
| #5 | Vermont | 39.7% | #5 | Illinois | $15.9B | |
| #6 | Ohio | 39.0% | #6 | New York | $15.0B | |
| #7 | Missouri | 37.6% | #7 | Indiana | $11.5B | |
| #8 | South Dakota | 37.1% | #8 | Pennsylvania | $10.0B | |
| #9 | Indiana | 33.2% | #9 | Tennessee | $8.7B | |
| #10 | Wisconsin | 31.4% | #10 | Kentucky | $7.5B | |
On average, 15.0% of all U.S. international trade is with Canada – but as you can see above, some states are clearly more reliant on this trade than others.
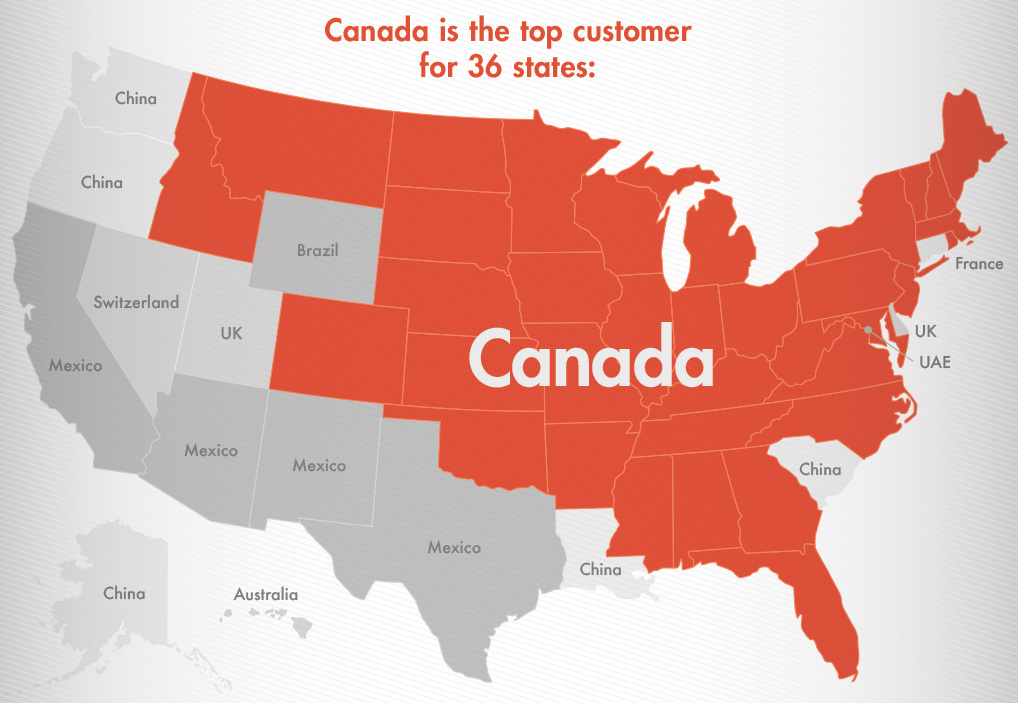
To put this in wider perspective, here’s a map we published as a part of a post on the world’s closest trade relationship. It shows that Canada is the top international destination of exports for 36 different states:

Imported from up North
Canada also sends a great deal of goods to the United States, as well.
The following states are the ones that import the most goods from Canada, and any changes to NAFTA could potentially impact these supply chains. If prices increase through tariffs, these businesses would have to either suck up the additional costs, or seek alternative inputs from other places.
| Imports from Canada, by % | Imports from Canada, by $ | |||||
|---|---|---|---|---|---|---|
| Rank | State | Imports (%) | Rank | State | Imports ($) | |
| #1 | Montana | 82.4% | #1 | Michigan | $48.3B | |
| #2 | Vermont | 69.1% | #2 | California | $27.8B | |
| #3 | Wyoming | 61.8% | #3 | Illinois | $25.3B | |
| #4 | North Dakota | 53.2% | #4 | New York | $17.6B | |
| #5 | Maine | 50.9% | #5 | Texas | $15.2B | |
| #6 | New Hampshire | 49.6% | #6 | Washington | $12.6B | |
| #7 | Michigan | 35.8% | #7 | Ohio | $11.5B | |
| #8 | South Dakota | 35.1% | #8 | Pennsylvania | $10.0B | |
| #9 | Virginia | 33.8% | #9 | Minnesota | $7.5B | |
| #10 | Oklahoma | 29.9% | #10 | New Jersey | $7.3B | |
Putting it Together
In percentage terms, northern states like North Dakota, Maine, Michigan, Vermont, and Montana are the most reliant on Canada for international trade both ways.
In many of those states, Canadian trade also tends to be large as a percentage of Gross State Product (GSP): Michigan (15%), Vermont (14%), Montana (9%), North Dakota (8%), and New Hampshire (7%) are the most affected using this criteria. Meanwhile, states like Illinois, Indiana, Ohio, Kentucky, and Maine each trade with Canada for 6% of their total GSP value.
By using dollars as a metric, Michigan is the state that will be impacted the most – it imports $48.3 billion, while exporting $23.7 billion to Canada.


