Commuters and Computers: Mapping U.S. Megaregions
From California’s Bay Area to the highly-integrated Great Lakes Economy, megaregions are a dominating aspect of human geography and commerce. It should be no surprise then, that 85% of corporate head offices in the US and Canada are overwhelmingly concentrated in the core cities of great megaregions.
We tend to think of cities as individual economic units, but as they expand outward and bleed together, defining them simply by official jurisdictions and borders becomes difficult. After all, many of the imaginary lines divvying up the country are remnants of decisions from centuries ago – and other county and state lines exist for more counterintuitive reasons such as gerrymandering.
What if there was a more data-driven approach to examine America’s urban networks?
Computer, Take The Wheel
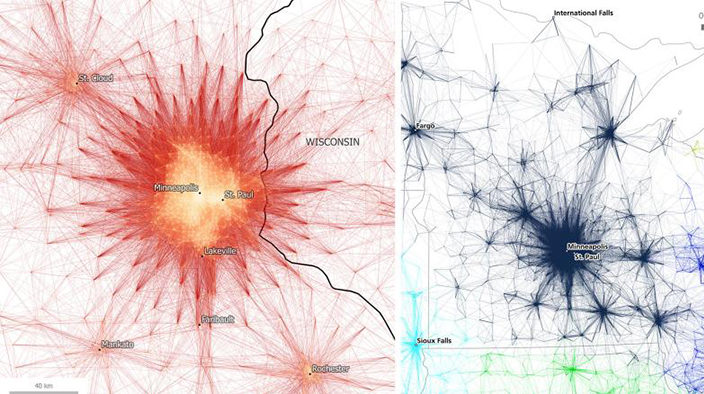
By ignoring borders and looking purely at commuter data, geographer Garrett Nelson and urban analyst Alasdair Rae looked to map the relationship between population centers in their paper, An Economic Geography of the United States: From Commutes to Mega-regions.

Researchers used visual and algorithmic approaches to build their map.
The study used network partitioning software to link together 4 million commutes between census tracts. This gives us a very granular look at the “gravitational pull” of America’s population centers, and helps us better understand the economic links that bind a region together.
By combining visual and mathematical approaches, and some creative place-naming, the researchers created a map that they hope reflects America’s true economic geography.

Algorithmic Insights
The concept of megaregions is hardly new, and there are already definitions for global megacities that use everything from infrastructure systems to light patterns derived from satellite imagery.
That said, this research is fine example of using data and an algorithmic approach to look at systems in a new way, unburdened by our political and cultural preconceptions.


