Chart: Measuring Global Competitiveness
The Chart of the Week is a weekly Visual Capitalist feature on Fridays.
What makes an economy competitive at the global level, and why?
It’s a question that economists, investors, and politicians have been asking themselves for decades. And to help answer it, the World Economic Forum has created the Global Competitiveness Index, or GCI.
How can we measure competitiveness?
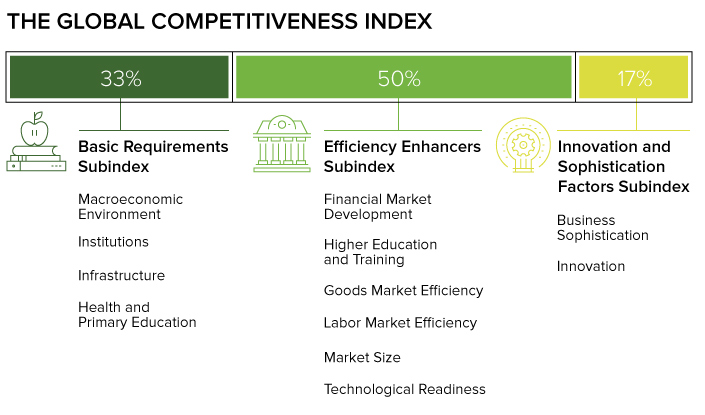
To figure out how countries compare on the world stage, the GCI is calculated based on 114 economic metrics ranging from the quality of infrastructure to the amount of government debt.
This wide variety of metrics is organized into a set of 12 pillars, as follows:

Global Competitiveness by Country
Based on the latest edition of the report, Switzerland (5.81) is the most competitive country in the world, having held the leading position since 2010 after it outpaced the United States (5.70) in the wake of the financial crisis.
| Rank | Country | Current Score (2016) | Previous Score (2015) | Change |
|---|---|---|---|---|
| 1 | Switzerland | 5.81 | 5.76 | 0.05 |
| 2 | Singapore | 5.72 | 5.68 | 0.04 |
| 3 | United States | 5.70 | 5.61 | 0.09 |
| 4 | Netherlands | 5.57 | 5.50 | 0.07 |
| 5 | Germany | 5.57 | 5.53 | 0.04 |
| 6 | Sweden | 5.53 | 5.43 | 0.10 |
| 7 | United Kingdom | 5.49 | 5.43 | 0.06 |
| 8 | Japan | 5.48 | 5.47 | 0.01 |
| 9 | Hong Kong | 5.48 | 5.46 | 0.02 |
| 10 | Finland | 5.44 | 5.45 | -0.01 |
| 11 | Norway | 5.44 | 5.41 | 0.03 |
| 12 | Denmark | 5.35 | 5.33 | 0.02 |
| 13 | New Zealand | 5.31 | 5.25 | 0.06 |
| 14 | Taiwan | 5.28 | 5.28 | 0.00 |
| 15 | Canada | 5.27 | 5.31 | -0.04 |
Picturing Competitiveness
Global competitiveness is a multi-faceted metric, but our understanding of it becomes clearer when compared with more standard measures such as GDP per capita (PPP).
The interactive graphic below from Knoema plots GDP per capita against GCI between 2006-2015, showing how the relationship between competitiveness and wealth has changed over time for numerous countries.
It is clear that competitiveness and GDP are positively correlated. In other words, the ability to be structurally and organizationally competitive creates conditions that are ideal for economic growth.
Don’t Worry, Be Happy
Competitiveness and growth in economic output may be related, but the infrastructure needed to stay globally competitive may confer other benefits to competitive ability and quality of life that go beyond GDP.
The Happy Planet Index (HPI) measures the sustainable well-being of citizens in any given country, and is plotted here against GCI.
The correlation between these factors is still positive, but weaker.
Rwanda, for example, is by statistical measure one of the world’s unhappiest nations (3.52 HPI); it is roughly equally competitive with the comparatively jubilant Costa Rican population (7.09 HPI), which also has a much higher GDP per capita.
On the other hand, a country can still be happy without being particularly competitive on a global basis. For example, Argentina (6.65 HPI) ranks in the bottom 50% of countries for global competitiveness (3.79 GCI).


