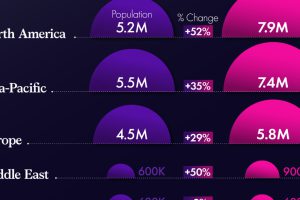
North America and the Middle East have experienced the largest percentage increase in the number of millionaires since 2016. Read more
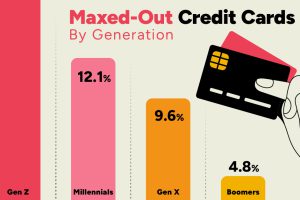
Younger credit card users tend to max out their credit cards more often than older generations, with 15% of Gen Z maxing out their cards. Read more
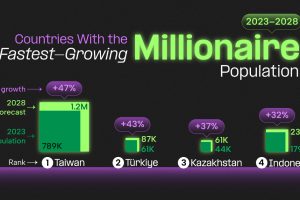
All of these countries are expected to have millionaire population growth rates of over 20% between 2023-2028. Read more

This infographic ranks the wealthiest 15 billionaires on the African continent. Read more

From New York to Damascus, this infographic uses EIU cost of living data to rank the world’s most and least expensive cities to live in Read more

This infographic shows the net minimum wage across 67 countries, as of January 2023. A breakdown by U.S. state is also included. Read more
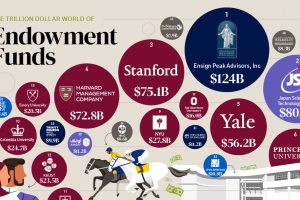
Endowment funds represent the investment arms of nonprofits. See the worlds top 50, which collectively have over $1 trillion in assets. Read more
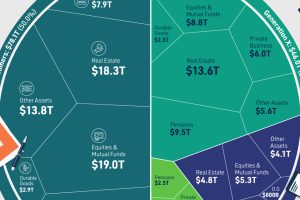
We’ve visualized data from the Federal Reserve to provide a comprehensive break down of U.S. assets by generation. Read more

Who are the wealthiest people in the United States? This map breaks down the richest billionaires in U.S. states. Read more
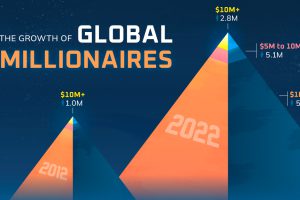
The world’s millionaire population has more than doubled in the last decade between 2012 and 2022. We visualize these numbers here. Read more

