Join us June 14th for a new event by Visual Capitalist, exploring how the next generation of data creators are adapting to an increasingly mobile-first world. Read more
Introducing the first challenge hosted by Visual Capitalist’s Creator Program! This is your chance to show-off your skills, impress the VC Editorial team, and win prizes. Read more

How do you visualize trade? These 9 graphics on the topic are the shortlist winners of our inaugural Creator Program Challenge. Read more

Join the waitlist now to be one of the first to use Voronoi. Read more
Get Visual Capitalist’s new app, Voronoi, and discover the world’s most interesting data and stories, all on one trusted platform. Read more
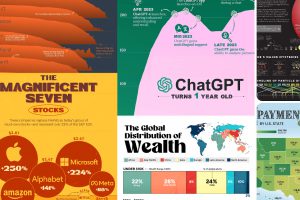
See the most popular, most discussed, and most liked visualizations on our new data storytelling app Voronoi in December. Read more

We round up the most popular, most discussed, and most liked visualizations of the month on Voronoi, our new and free data storytelling platform. Read more

We round up the most popular, most discussed, and most liked visualizations of the month on Voronoi, our new data storytelling platform. Read more


