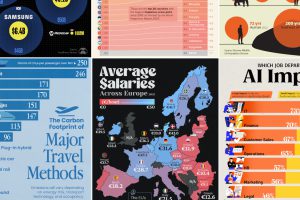
We round up the most popular, most discussed, and most liked visualizations of the month on Voronoi, our new data storytelling platform. Read more

We round up the most popular, most discussed, and most liked visualizations of the month on Voronoi, our new data storytelling platform. Read more

A collection of powerful visuals showing how the world is changing. Infographic book diving into tech, markets, and the global economy. Read more
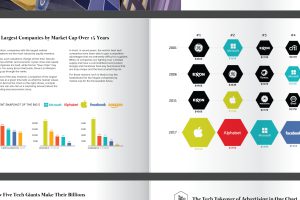
Two example spreads from Visual Capitalist’s new book ‘Visualizing Change’. Over 12 pages of infographics to sample here, as they would appear in the book. Read more

Wealth 101 is a new educational resource that uses infographics to explain topics related to personal finance and achieving financial independence. Read more

We round up the most popular, most discussed, and most liked visualizations of the month on Voronoi, our new data storytelling platform. Read more
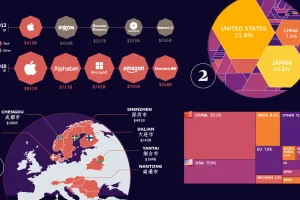
This special feature uses powerful charts and infographics to visualize the eight major forces that are shaping our global economy and the business landscape. Read more

Need to get something for the person who has everything, or the client who just loves jaw-dropping data? See why the Visual Capitalist book may be the answer. Read more

Submit your idea for the chance to win great prizes, including having your infographic idea designed and published, or a signed copy of our new book! Read more

We round up the most popular, most discussed, and most liked visualizations of the month on Voronoi, our new data storytelling platform. Read more

