
States with long coastlines tend to host the most active duty troops, with one exception, home to the services’ newest branch. Read more
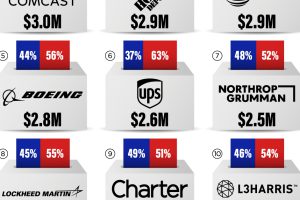
Political action committees, or PACs, are major players during U.S. federal elections. Which way are company PACs donating in 2024? Read more
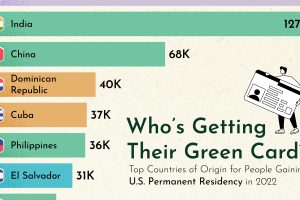
This visualization ranks the top 15 countries of origin for people who gained U.S. green cards (permanent residency) in 2022. Read more

Union membership can look very different depending on where you live. Which state has the highest rate of union membership in 2023? Read more
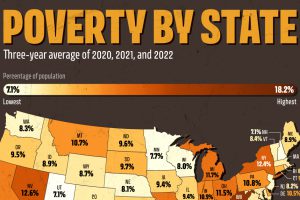
U.S. poverty rates were relatively higher in the South, compared to northern states. Which states saw the highest rates in 2022? Read more

From the Erie Canal to the Golden Gate Bridge, U.S. municipal bonds have financed crucial infrastructure. This infographic details their long history. Read more
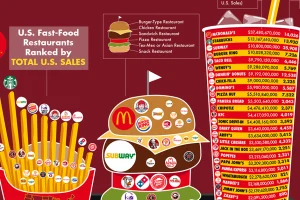
Every year, fast food chains rake in north of $200 billion in revenue per year. Here are the biggest chains, ranked by revenue and number of locations. Read more
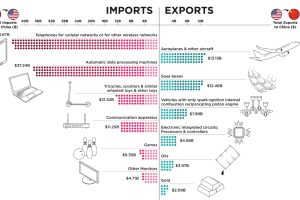
This infographic ranks the top 10 exports and imports of the U.S. and China, the two most significant global economic superpowers today. Read more
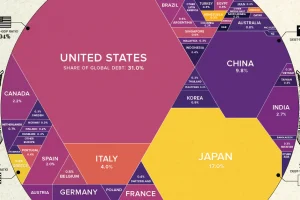
What share of government world debt does each country owe? See it all broken down in this stunning visualization. Read more
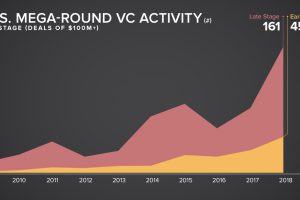
With bigger deals and multi-billion dollar IPOs, venture capital financing is reaching new heights. This infographic explores the latest trends. Read more

