


Which states have the lowest credit card delinquency rates in America, and which have the highest? Read more
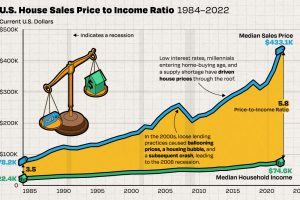
We chart the ever-widening gap between median incomes and the median price of houses in America, using data from the Federal Reserve from 1984 to 2022. Read more

We visualized the top U.S. companies by employees, revealing the massive scale of retailers like Walmart, Target, and Home Depot. Read more
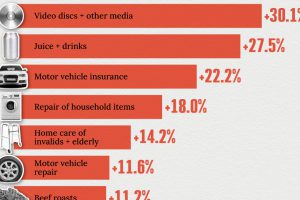
We visualized product categories that saw the highest % increase in price due to U.S. inflation as of March 2024. Read more
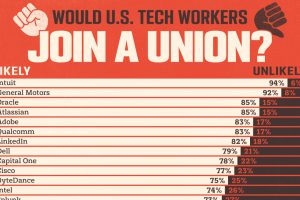
The last few years have seen mass layoffs at Google, Amazon, and Tesla. Has this impacted how tech workers feel about unions? Read more
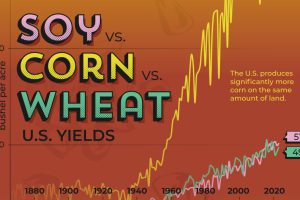
With nearly 180 bushels of corn grown per acre in 2023, this is the data behind the corny American love story. Read more

Growing the big four American crops—corn, soybean, hay, and wheat—require farmlands bigger than entire countries. Read more
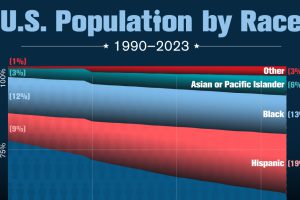
The nation’s non-white population has nearly doubled since 1990. Read more

Analyzing performance across ten weighted metrics, reveals the vertical strip of states that work the hardest. Read more

Will your job be in less demand in the future? See which occupations have the most projected job cuts from 2023 to 2033. Read more