Services-producing industries account for the majority of U.S. GDP in 2023, followed by other private industries and the government. Read more

We highlight the top 15 U.S. metro areas by their percentage of million-dollar homes, from San Francisco to Miami. Read more

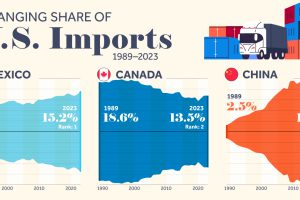
We highlight seven key U.S. trade partners and their changing share in the sources of U.S. imports from 1989–2023. Read more

To offer perspective on the population of U.S. states, this map compares them to countries that share similar population sizes. Read more

The U.S. might have a median age of 39, but the median age by state ranges from the low 30s to the mid 40s. Read more

Glassdoor’s annual list is determined by an algorithm that converts reviews to ratings—here are America’s 15 best places to work since 2020. Read more

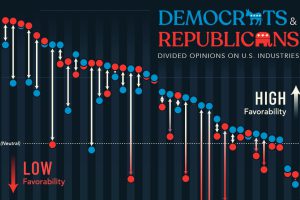
A survey looked at U.S. industry favorability across political lines, showing where Democrats and Republicans are divided over the economy. Read more

Wealth distribution in America is becoming increasingly unequal, with the wealth held by the top 0.1% reaching its highest level on record. Read more


